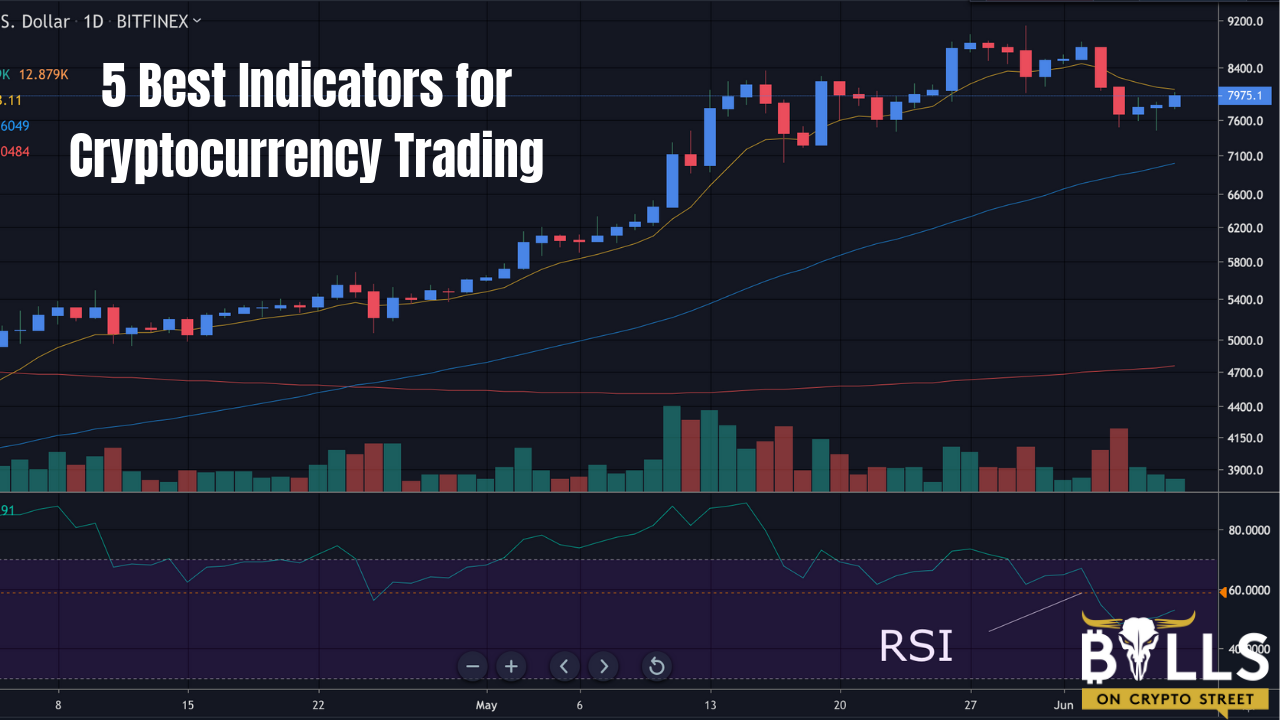
Cryptocurrency prices can seem random and chaotic. Some days they go up 10-20%, some days they dump 5-10%. This is why the most successful crypto traders and investors use technical indicators. The best indicators for cryptocurrency trading help make sense of price action, and help you predict where the price will likely head in the future.
In this article we will talk about my favorite indicators I use on a daily basis to day trade and swing trade cryptocurrencies. Before we talk about what indicators I use, let’s start by defining them, and how they are generally used in the trading world:
How To Use Indicators For Cryptocurrency Trading
If you are unfamiliar with trading indicators, technical indicators are tools that traders and investors use to help analyze past price past action and to indicate where a crypto will head in the future. They are a crucial component of successful strategies based off technical analysis.
There are no holy grail indicators that guarantee a trade will be a winner. I am not going to BS you. These indicators provide confirmation of a trade thesis. They are not black and white buy and sell signals. New traders in our trading chatroom sometimes struggle because they become too over-reliant on technical indicators. Do not think that indicators are a failure because they didn’t work on one trade. Indicators are used to support a thesis, but they shouldn’t be the sole reason you put on or take off a trade.
Moving Averages
Moving averages are my favorite indicator for cryptocurrency trading out of all the ones I will mention on this list. There are two types of moving averages we trade with: Simple moving averages and exponential moving averages. Simple moving averages are simply the average price of a coin over a certain time period.
For example, a 20 SMA on the daily chart frame will be a line on the chart representing the average price of the prior 20 days. An exponential moving average is the same, except that it gives more weight to recent price action, so it will more closely follow the current trading price. You will see examples of three different moving averages I use on the charts below.
Moving averages are useful for all traders and investors of cryptos. Whether you are a day trader, swing trader, or long term investor, moving averages can provide significant value to you. They can act as support or resistance, and allow you to quickly identify a coin’s trend.
9 EMA
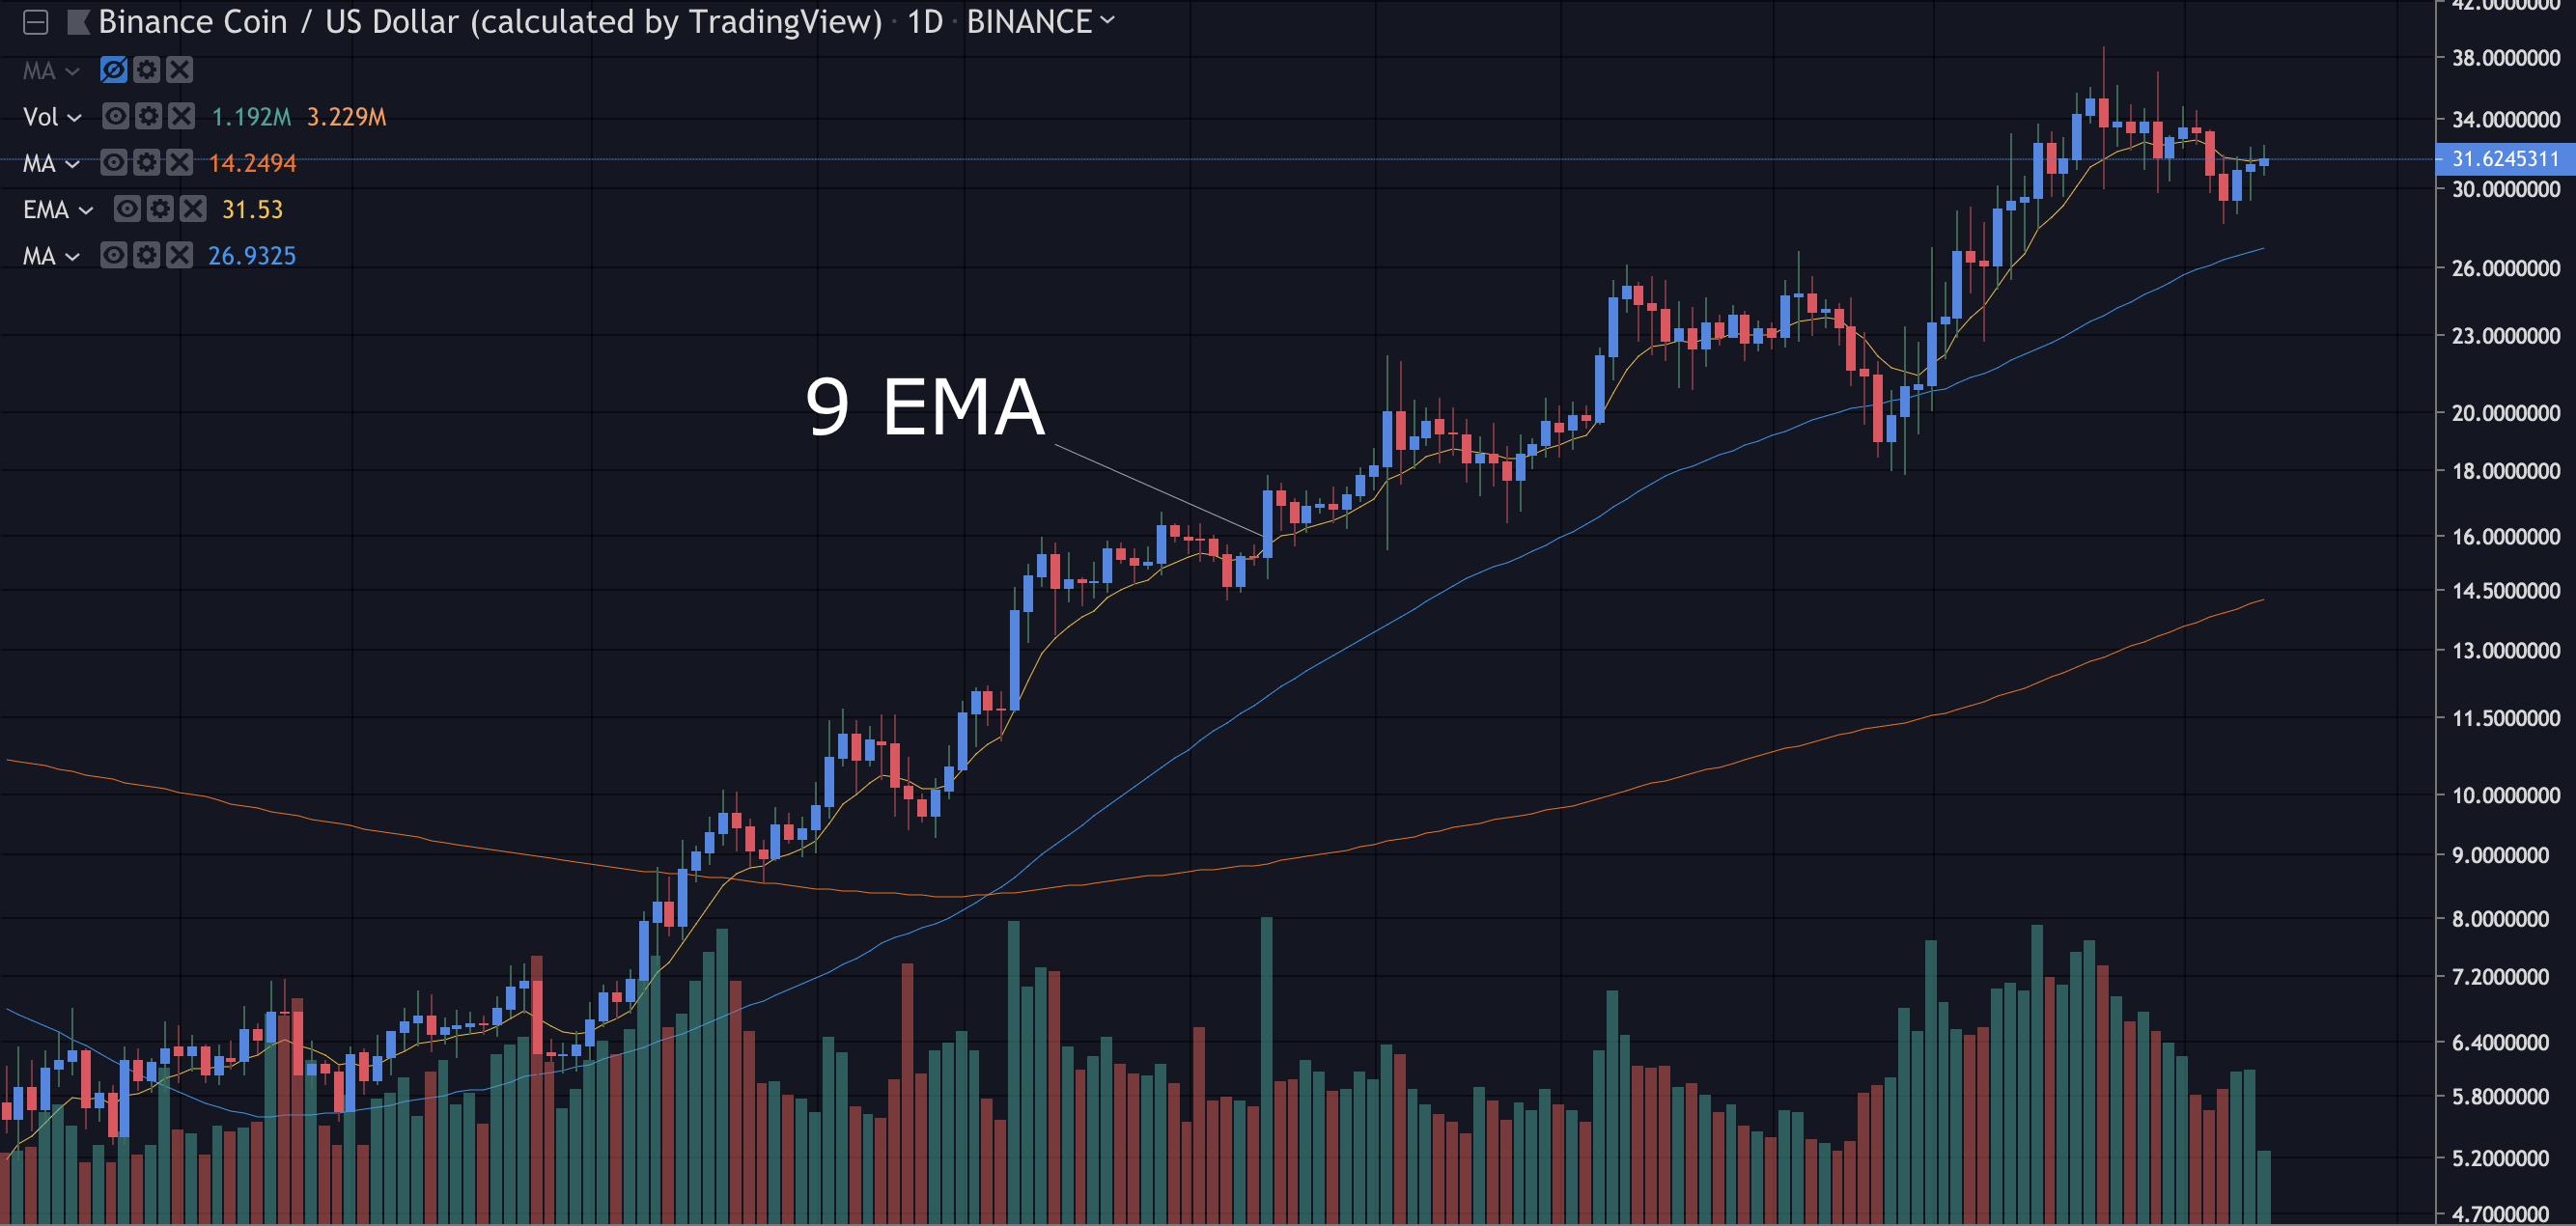
The 9 EMA is the moving average for short term trends. You can see on the BNB (Binance Coin) Daily chart how it has been trending with the 9 EMA pretty much this whole year. It is also useful for identifying trends on the lower time frames for day trades, such as on the 15 minute and 1-hour candlestick charts. The most explosive trends will often trend on their 9 EMA.
50 MA
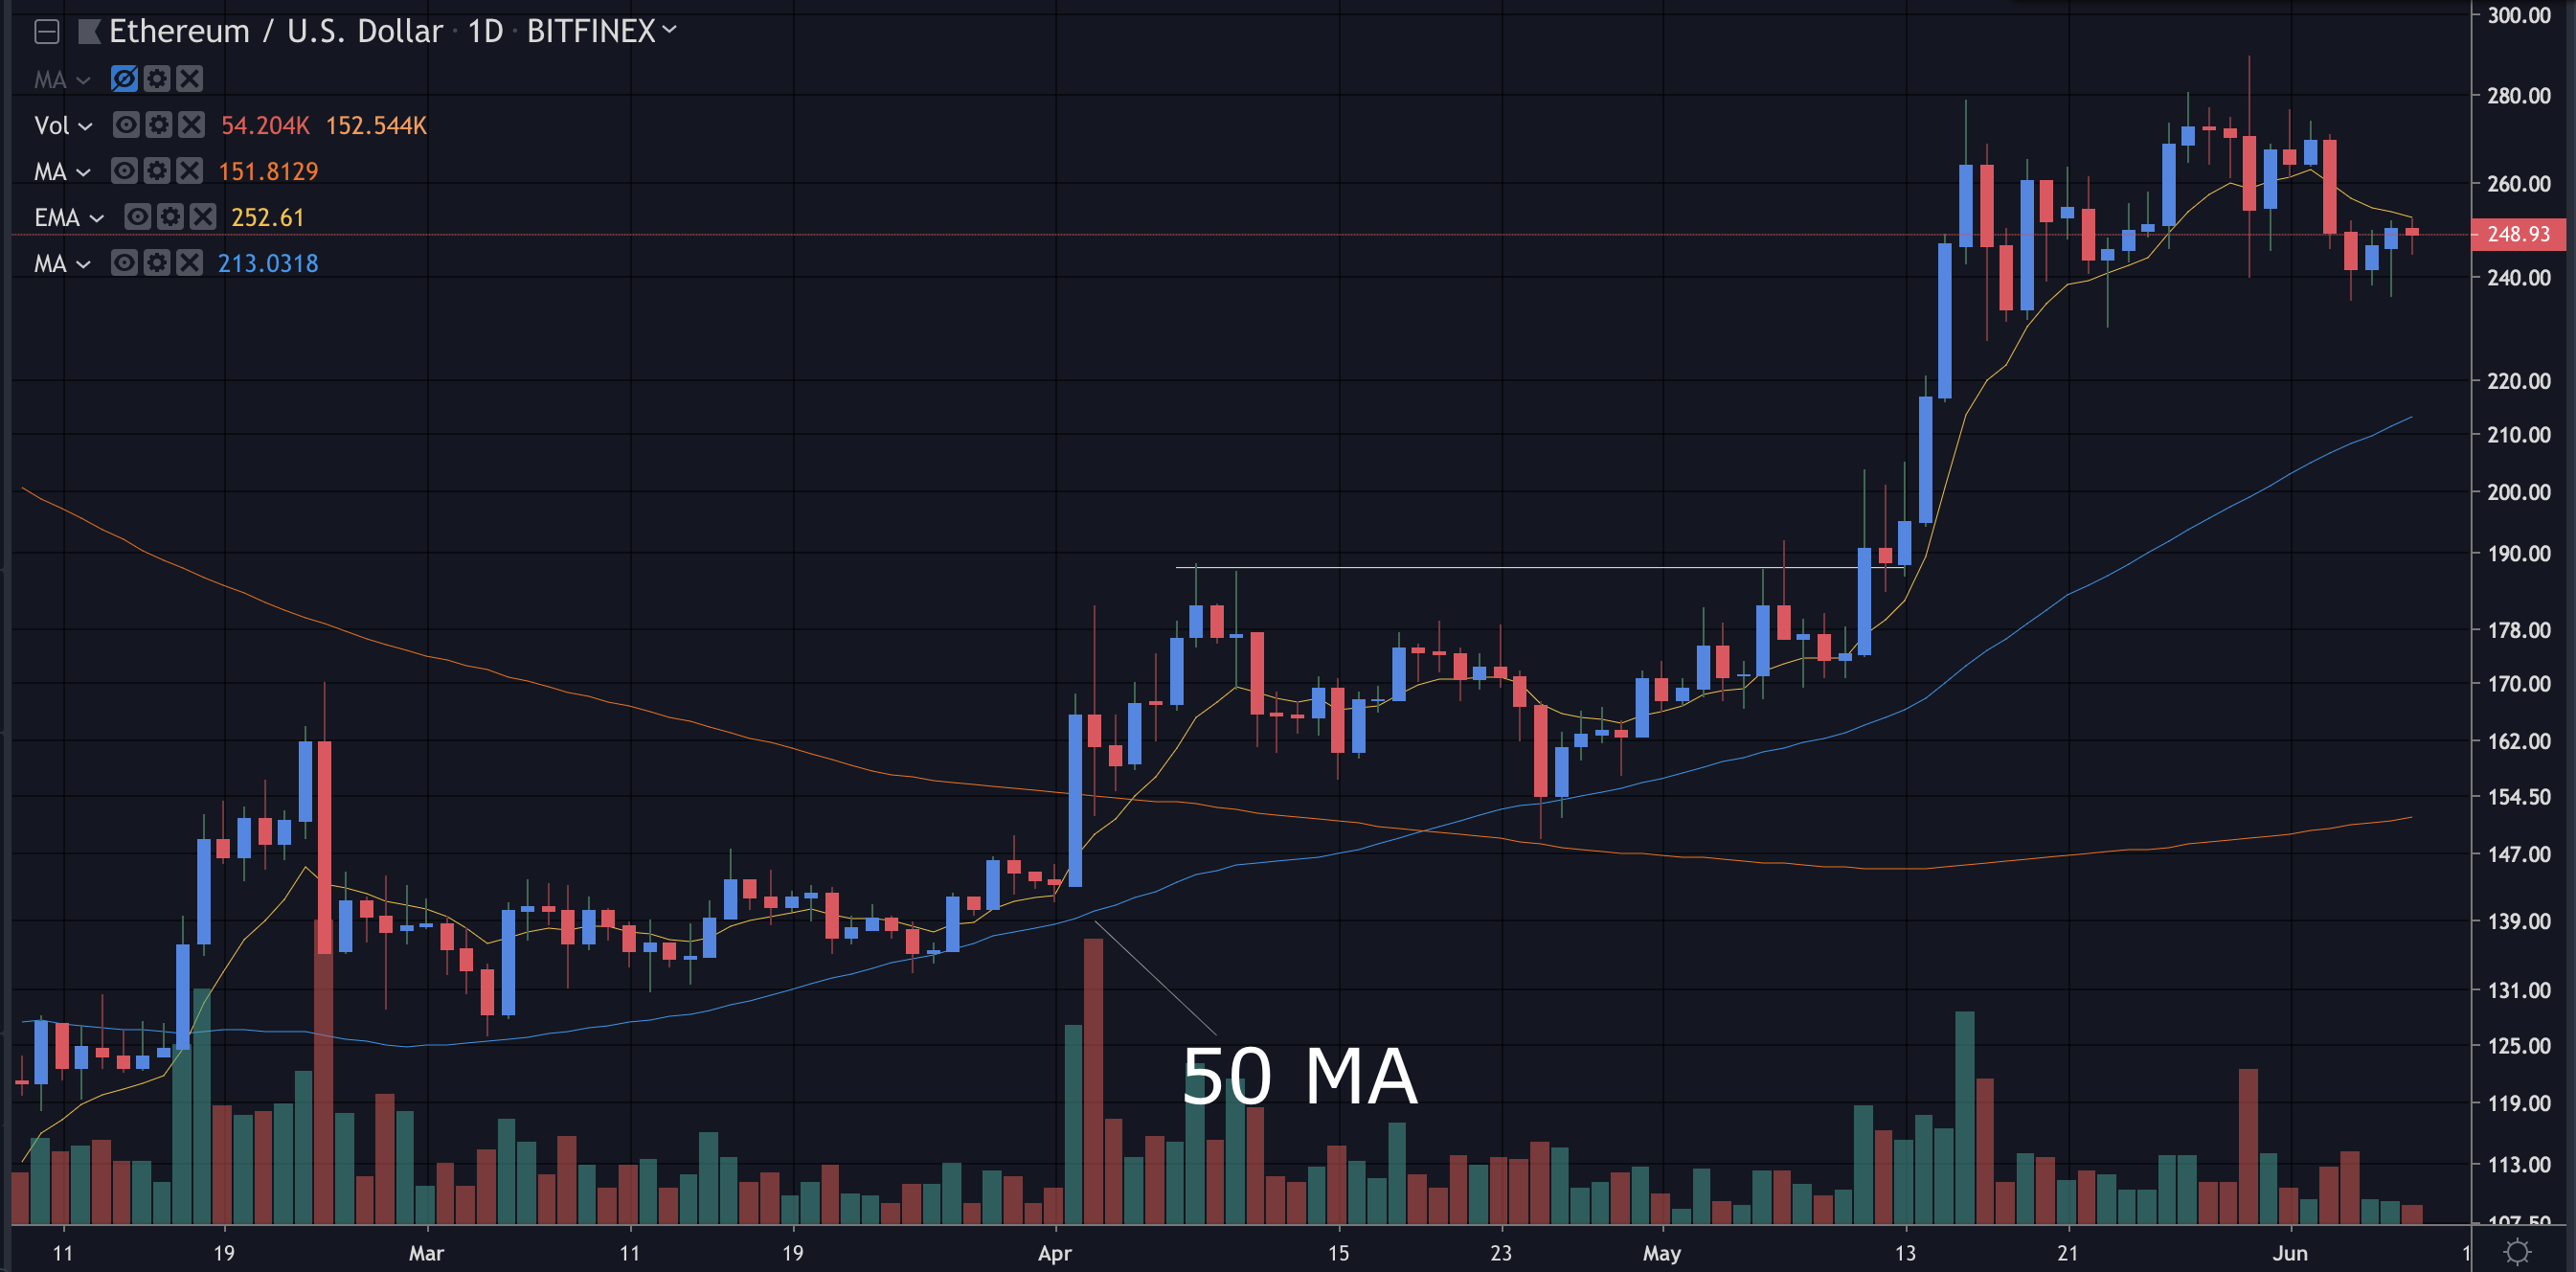
The 50 simple moving average is useful for identifying the intermediate trend of the time frame you are looking at (the 20 MA can also be used). It will often act as support and resistance on slower, more choppy trends, unlike the 9 EMA which is for fast and explosive ones. You can see how the 50 MA on ETH’s daily chart it acted as support for most of this year.
200 DMA
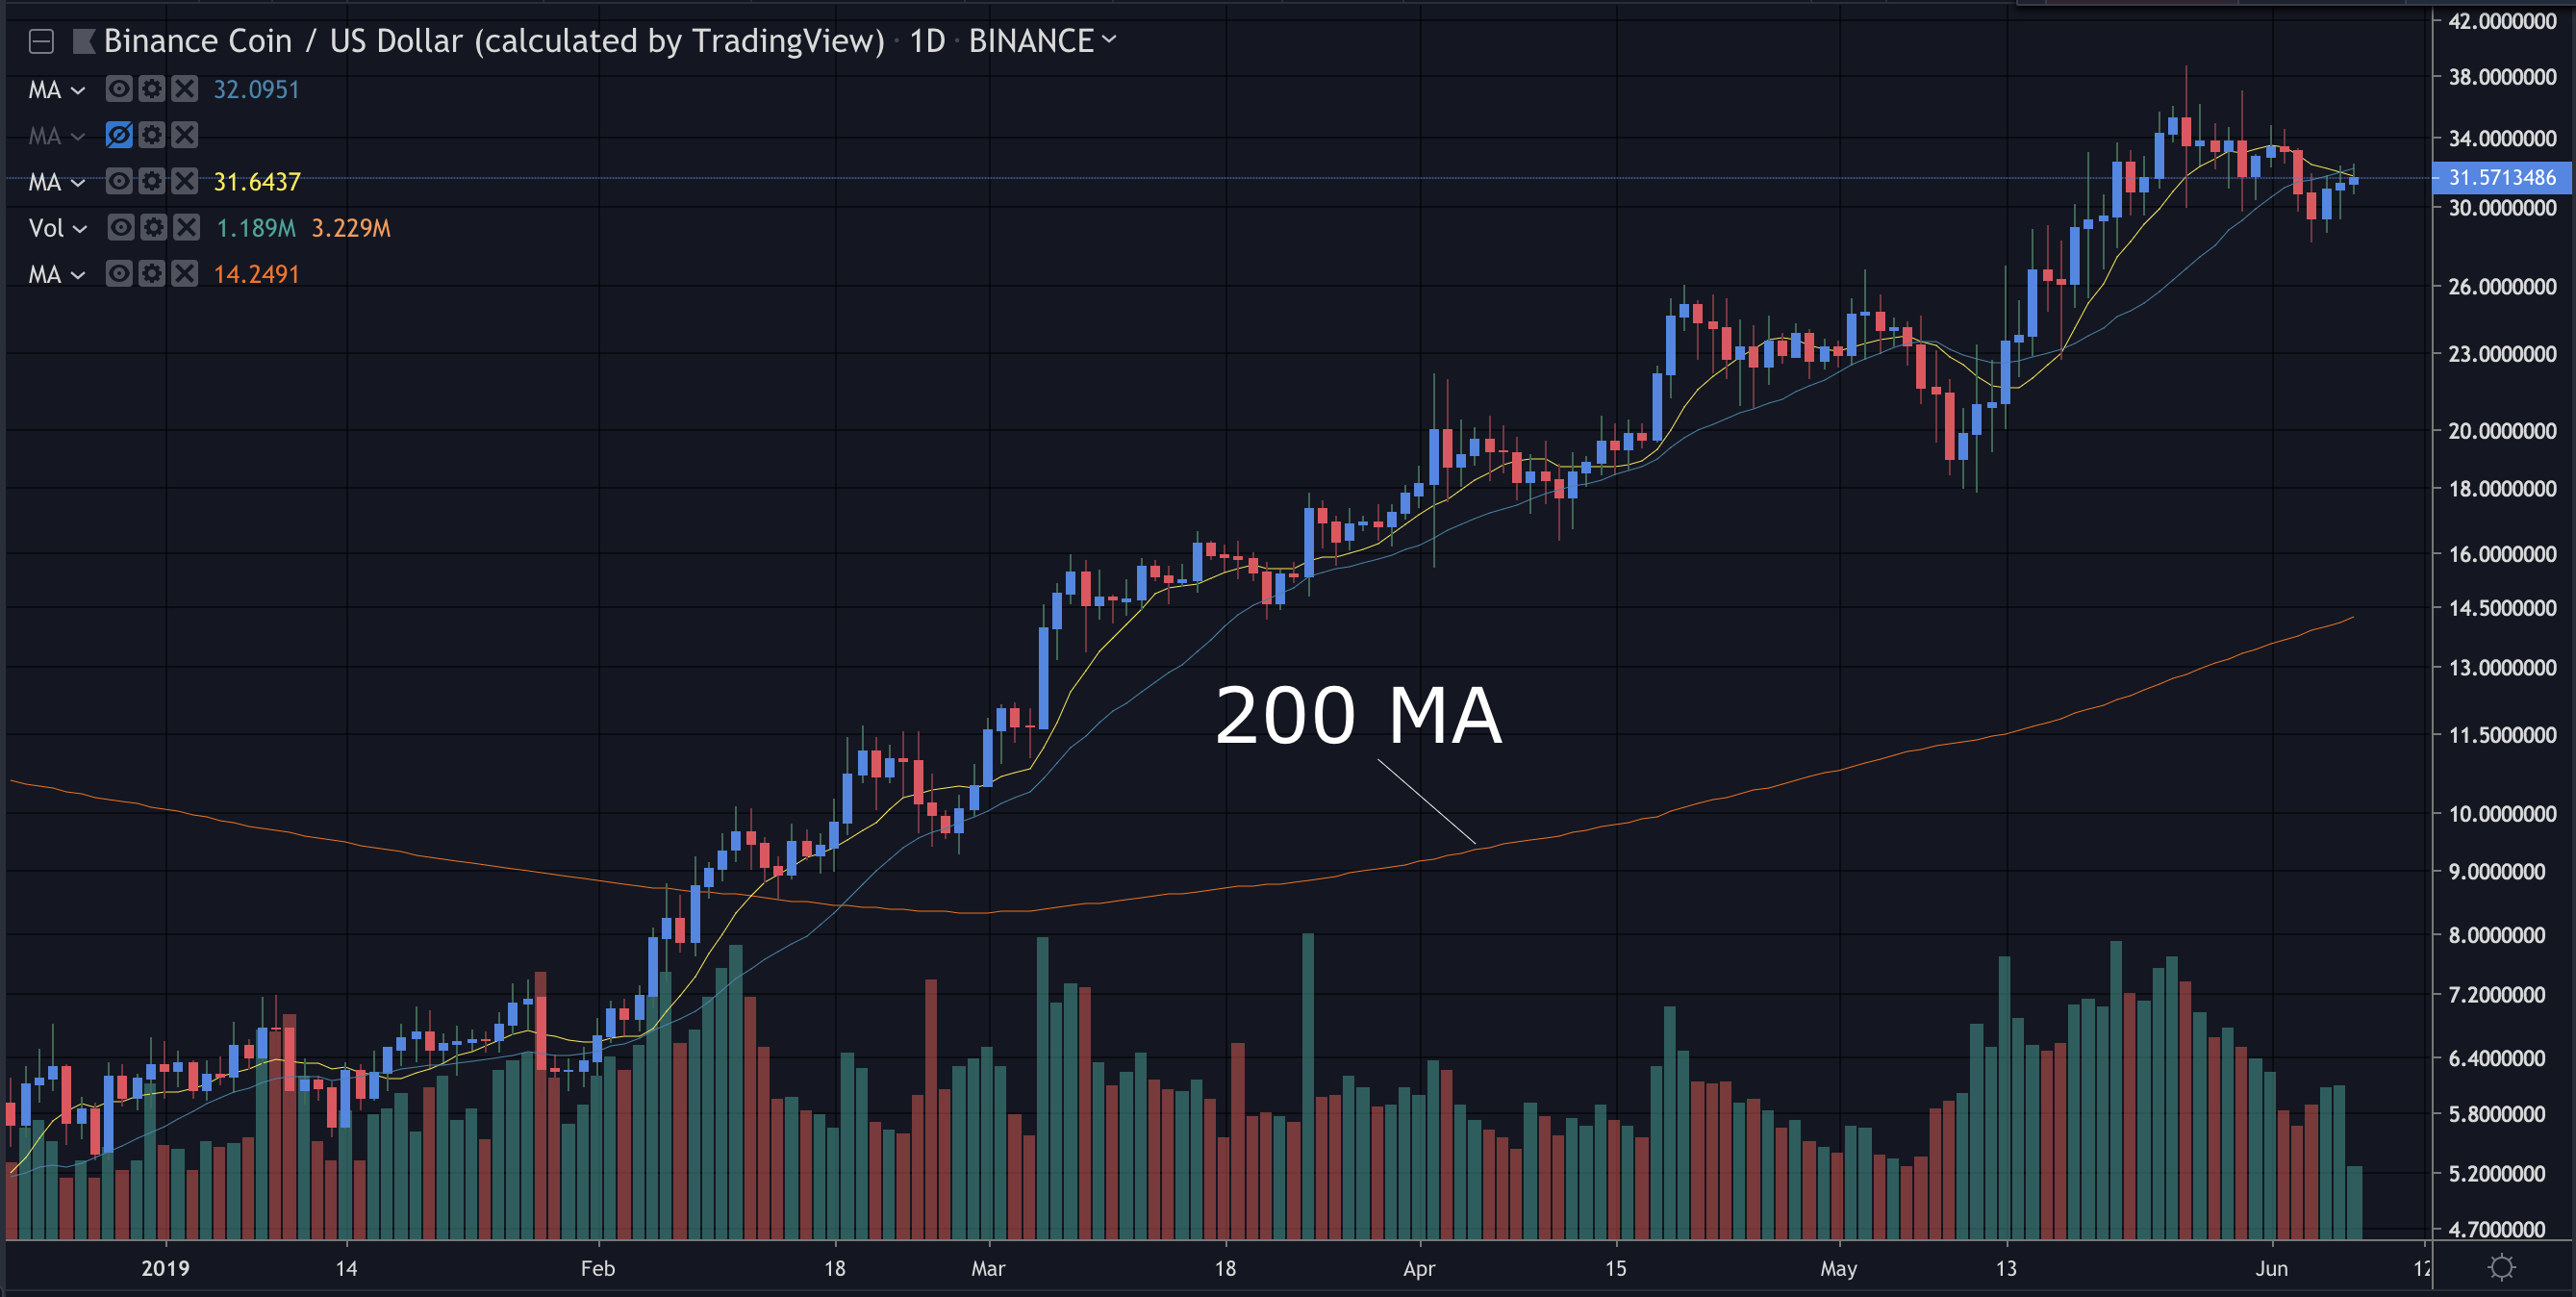
The 200 DMA stands for daily moving average. This is the mother of all moving averages. It is a great indicator of the long term trend of a cryptocurrency coin. A coin trading above its 200 DMA is considered to be bullish. A coin trading below is considered to be bearish. You can see how BNB breaking above its 200 DMA ignited an over 400% move back in early February.
VWAP
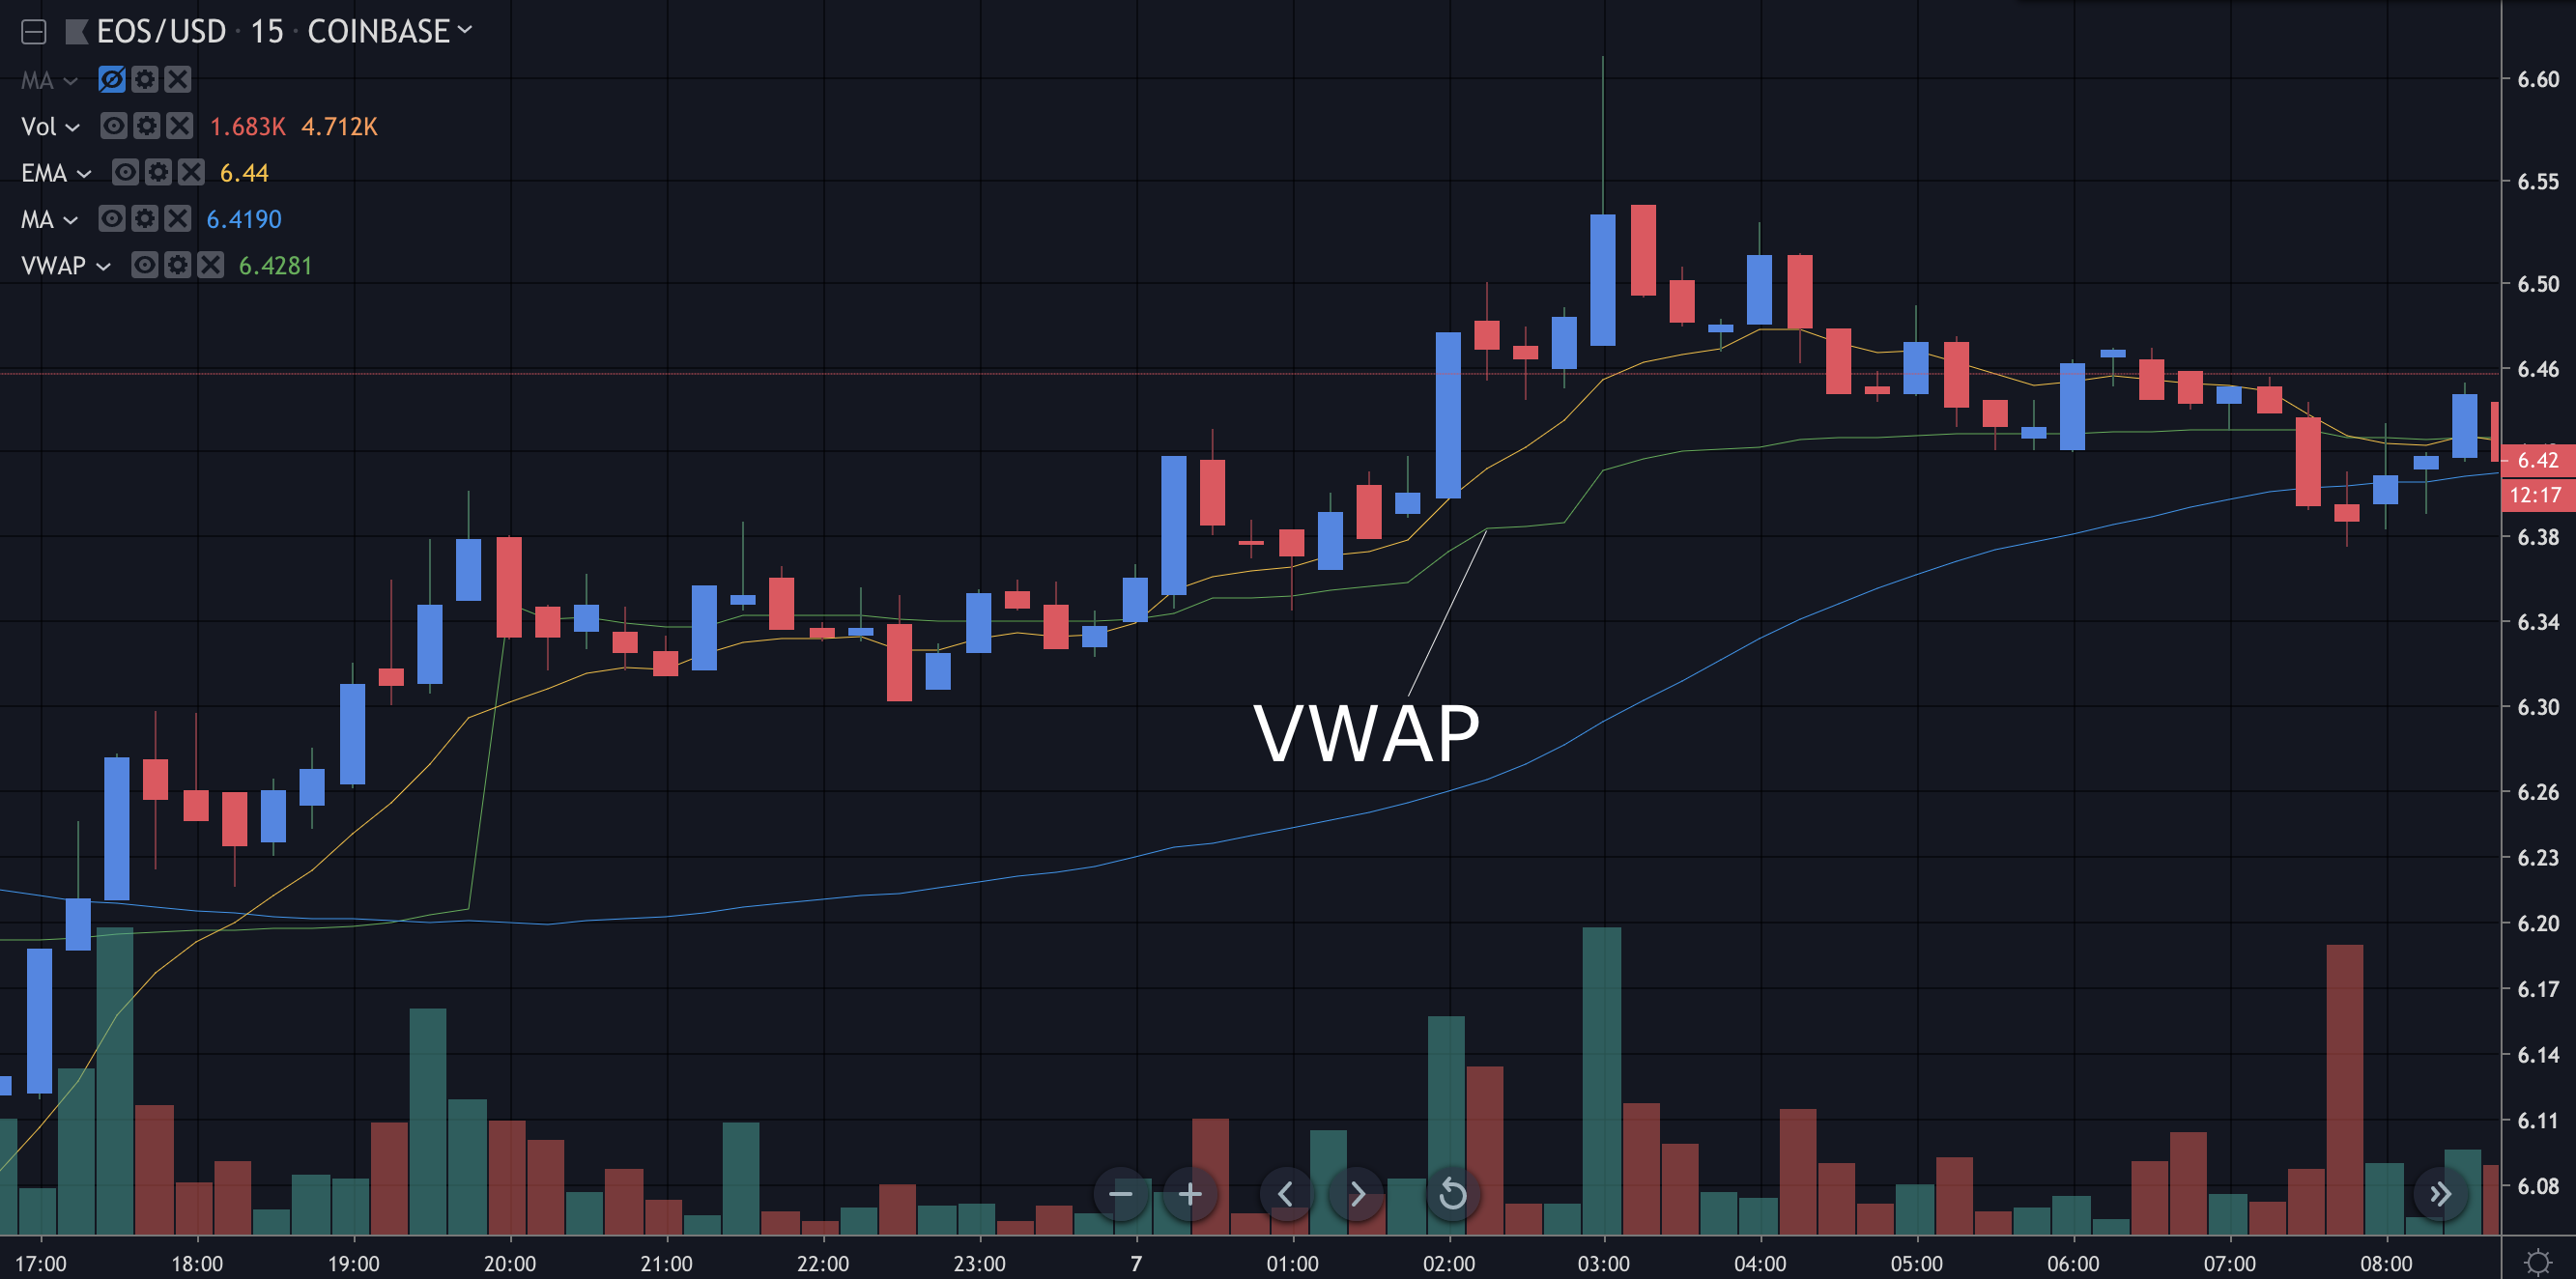
VWAP stands for “Volume-Weighted Average Price”. Essentially this indicator shows you the average price of the holders of the crypto you are watching. It is primarily an indicator for short term trading on cryptos. When crypto is trading above VWAP, it means most of the traders in the coin are in the green in their positions. When a coin is trading below its VWAP, it means most of the traders in the coin are down on their positions on the time frame you are looking at. It is also an indicator that will often act as support and resistance on the shorter term time frames.
RSI
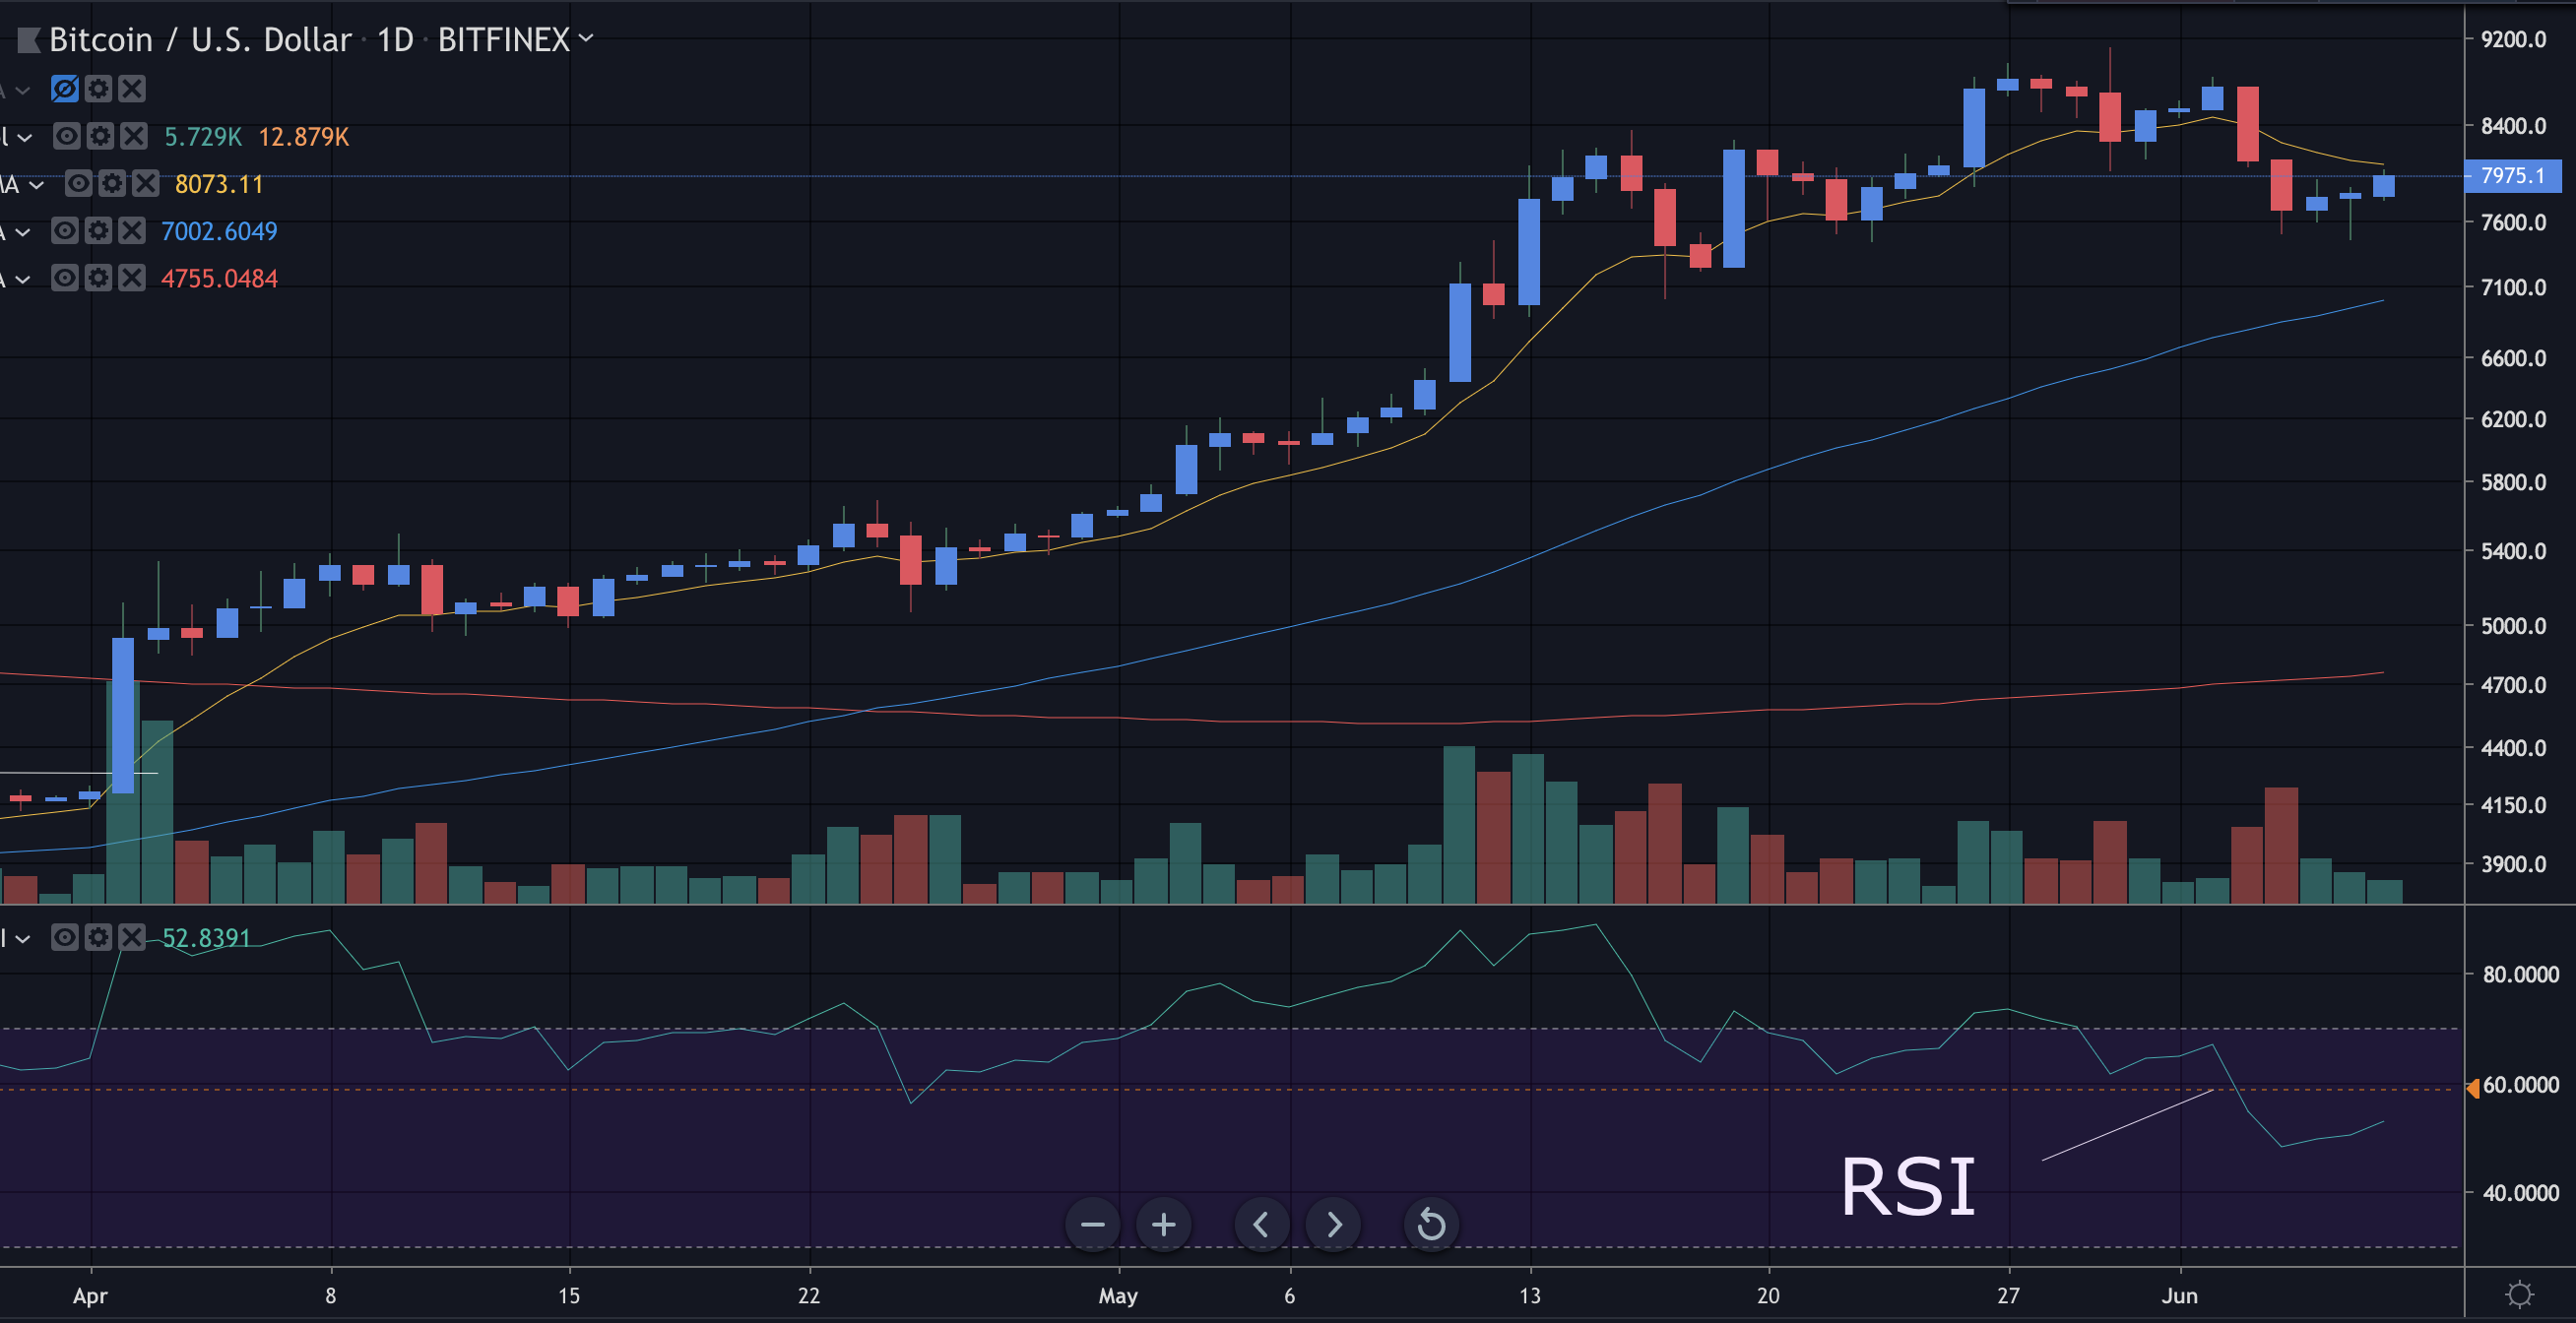
RSI stands for “Relative Strength Index.” It is simply an indicator that measured how overbought and oversold a coin is. An RSI of 80 or above is considered to be overbought. An RSI of 30 or below is considered to be oversold. Don’t make the mistake of just buying something because it has a low RSI, or shorting something that has a high RSI.
All of the charts you see in this article are from TradingView.
Check out this video below to watch me set up and explain the indicators on my own charts:
Cryptostreet
The crypto markets are finally seeing momentum and trend after months of a choppy, range-bound market. There are amazing opportunities in the market every week. If you are interested in joining the biggest community of crypto traders, check out our trading community Cryptostreet.
Click here to join Cryptostreet.
Sign up For Our Free Newsletter At the Bottom of This Page for Free Crypto Market Analysis on a Weekly Basis
Download the pdf version of this article here.
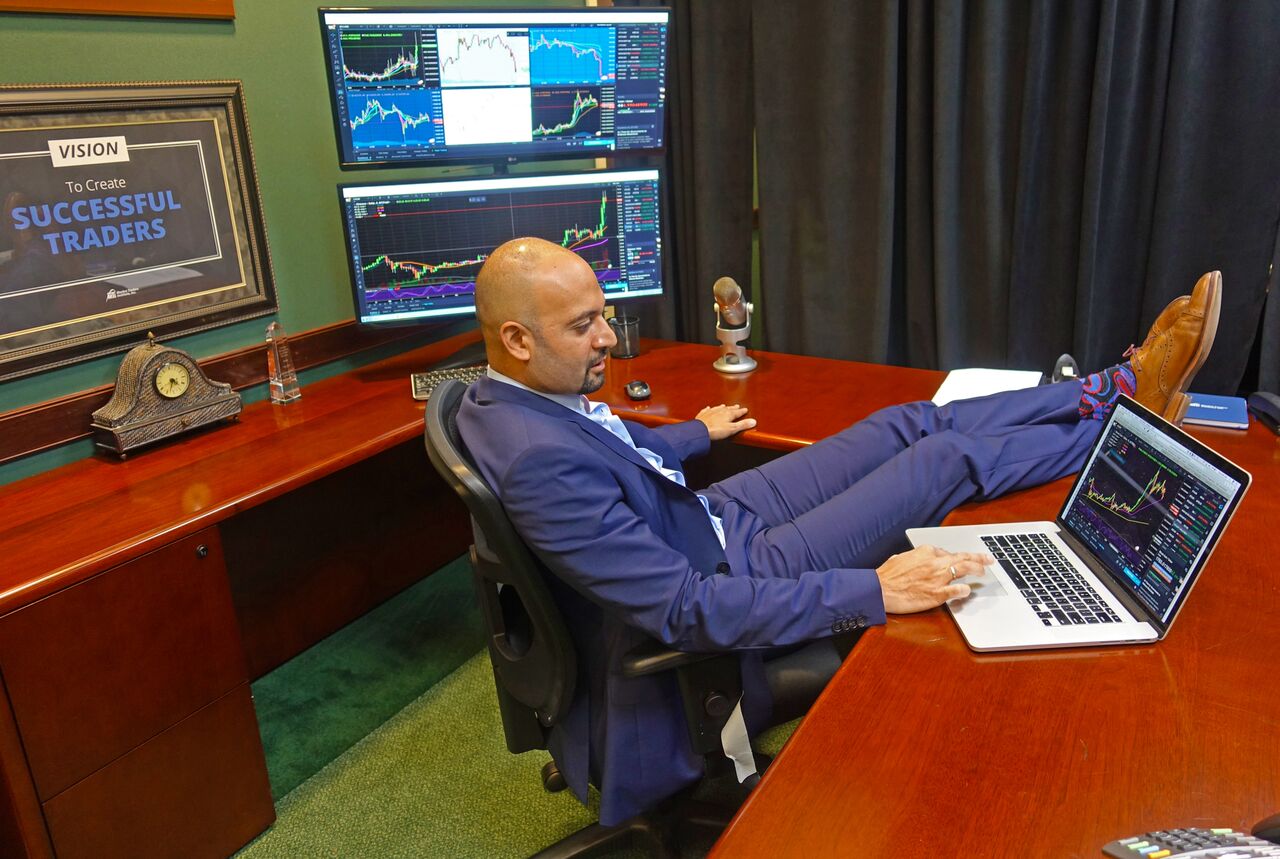
Kunal Desai is an American day trader (stocks and cryptos) and founder of Bulls on Wall Street and Bulls on Crypto Street, two online trading academies and informational publications. He has been featured in many high profile publications like Inc, Forbes, Buzzfeed, and Fortune. He has spoke at trading and business events all across the World.

I am interested in Crypto Trading, absolute Beginner, thank you
Thank you