
When it comes to Bitcoin volume, there are a few different metrics we can track. The most obvious being total trading volume across all exchanges. However, there is one thing to keep in mind about this number; the reported trading volume vs the real trading volume.
It is common knowledge in the crypto space that reported trading volumes on many exchanges are fake. Many of the less popular exchanges use tactics like wash-trading to inflate volume numbers to attract traders and pump coins. This is an illegal practise in traditional markets.
According to Messari, the reported trading volume currently is $8.28 billion and the real trading volume is $8.04 billion. This difference can fluctuate but it is slowly getting closer over time. Regardless, the trading market around Bitcoin is very liquid when we compare it to popular stocks like Apple which does $140,935,022 in average daily volume according to Yahoo Finance.
Bitcoin Transfer Volume
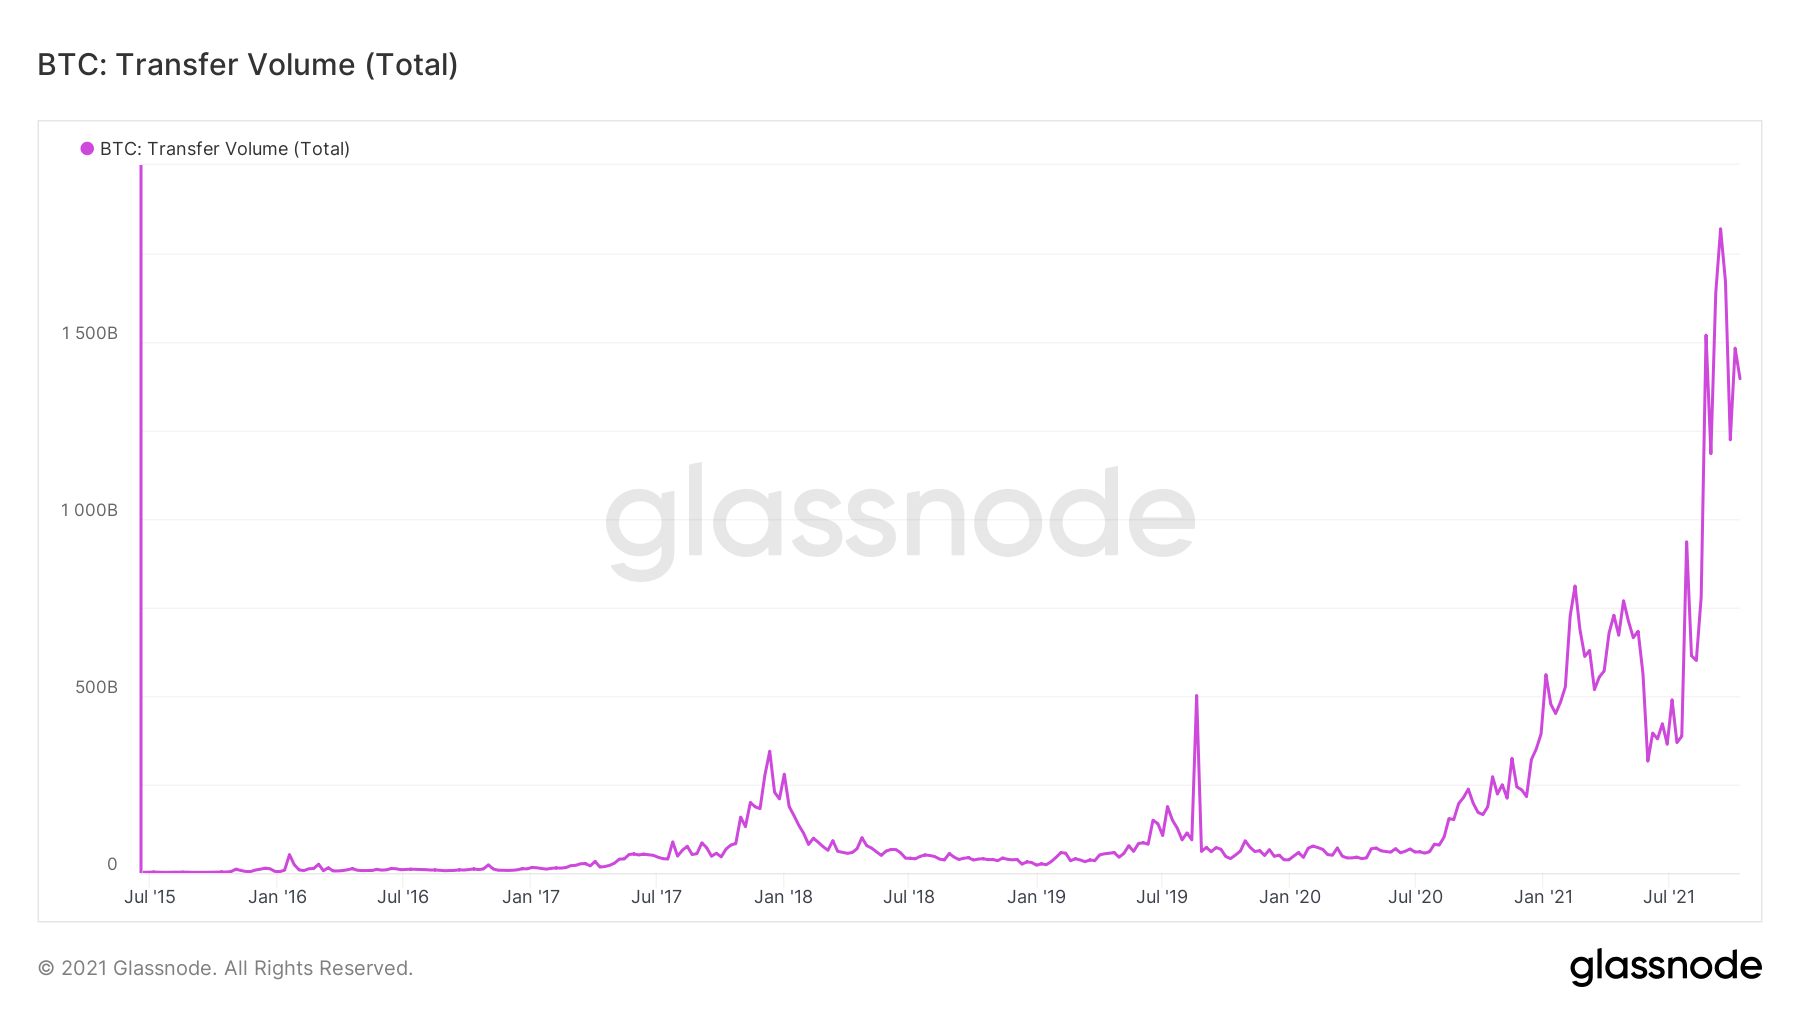
Bitcoin transfer volume by GlassnodeAbove we can see the Bitcoin transfer volume since 2016. Glassnode defines the transfer volume as, “The total amount of coins (USD Value) transferred on-chain. Only successful transfers are counted.”. This metric includes trading or transacting Bitcoin as well as transferring between wallets which could be owned by the same person. We see a peak in late 2017 at the time of the last bull market. As well, a massive peak and sharp fall during the time President Xi acknowledged Bitcoin as a store of value. Currently, we’re seeing these levels well past all-time highs and trending higher during this bull market.
Bitcoin Futures Volume
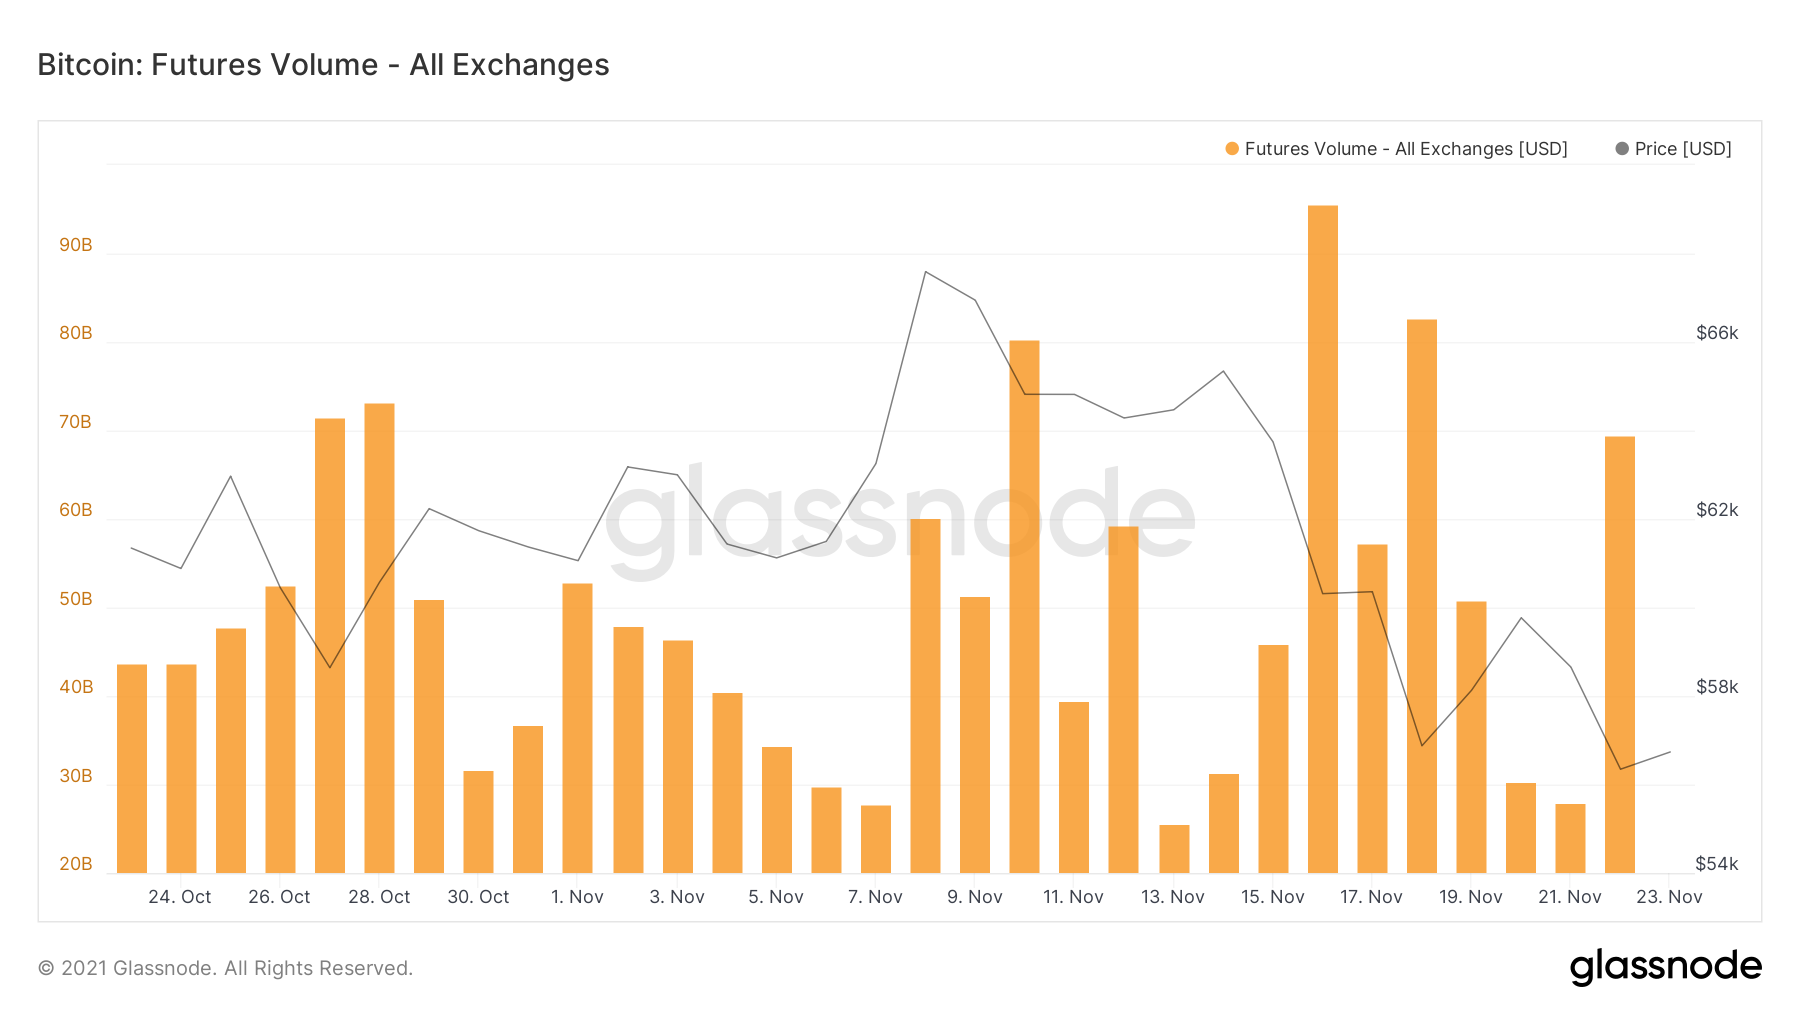
Bitcoin also has a derivatives market. Most exchanges offer Bitcoin futures trading. This means that instead of taking possession of the Bitcoin when the trade is made, the trader is buying or selling a futures contract. It sounds complicated but realistically it’s very similar to spot trading. This is also a high growth market for Bitcoin and gives a sense of demand as volume increases and decreases.
Diversification
Coingecko is currently tracking thousands of Bitcoin markets. I tried to get the exact number but it was taking forever to view the whole list (I got to 2000). This includes all major fiat currencies, most, if not all cryptocurrencies, and even some commodities. Let’s not forget that PayPal has now opened up a Bitcoin market and banks have been given the green light in the US.
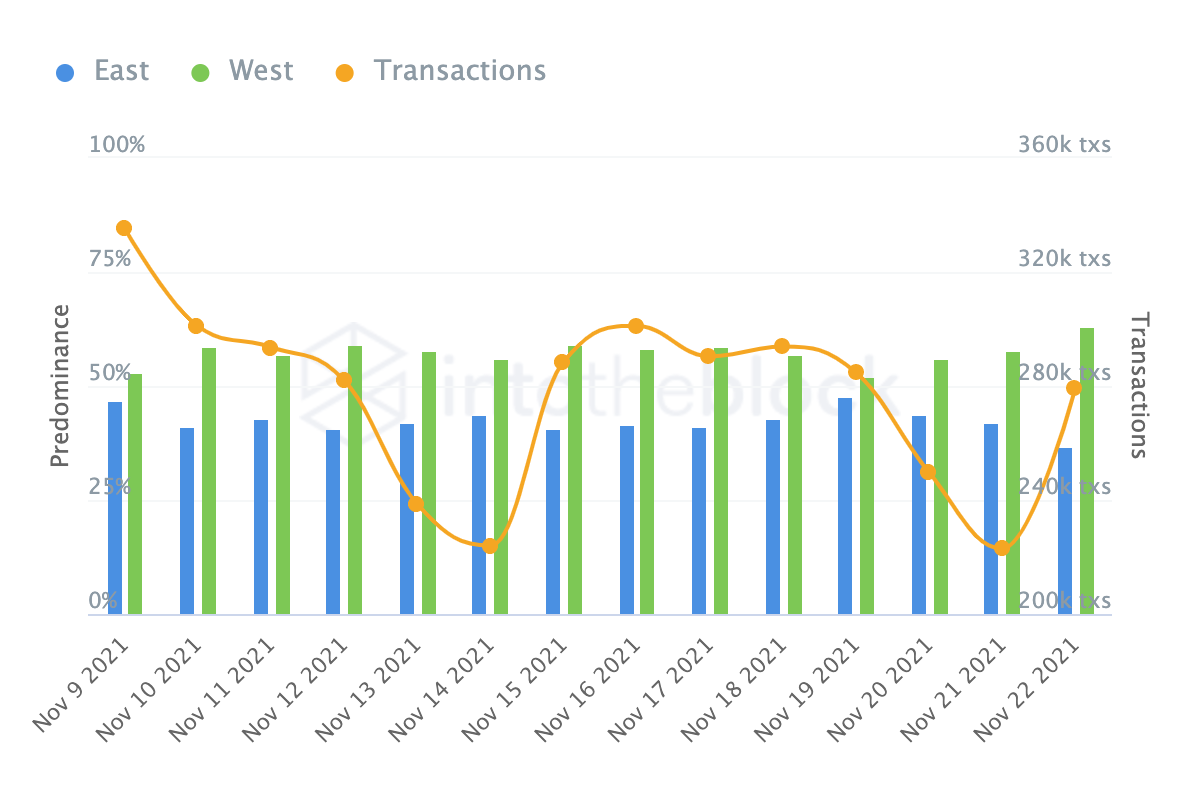
An interesting metric that IntoTheBlock provides is the location of the volume. According to IntoTheBlock, “This metric is calculated by comparing the number of transactions that take place between 10:01PM to 10:00AM UTC (Eastern times) versus the transactions that take place between 10:01AM to 10:00PM UTC (Western times).”. Over the last 14 days the west has been leading the way with Bitcoin transactions (57.47% west vs 42.53% east). If you look at the all time numbers, they’re consistent with the last two weeks as well.
This information can be useful for active traders that might want to set stop losses or take profit targets when going to sleep and expecting spikes in volume from the other side of the world.
Net Flow Volume
Net flow volume is the difference between Bitcoin flowing into exchanges and out of exchanges. This is important to track because if we notice many Bitcoin whales starting to deposit onto exchanges that could mean a few different scenarios.
According CEO of Crypto Quant Ki Young Ju, this could mean three possible outcomes:
- Whales are looking to buy alts using BTC which means an ‘Alt Season’
- Whales are looking to dump Bitcoin which can crash the price
- Whales have no intentions yet but want to keep it on exchanges for emergency purposes
Three possibilities for $BTC whale deposits:
1. #ALTSEASON
2. Dumping
3. Just deposit, not for trading (preparing in case of emergency) https://t.co/GIFg1wqhy2— Ki Young Ju ??? (@ki_young_ju) December 2, 2020
Vice versa also applies to Bitcoin flowing off exchanges. This could mean whales are accumulating and holding for the next bull run. A great buying opportunity.
We can track net flow volume with Glassnode.
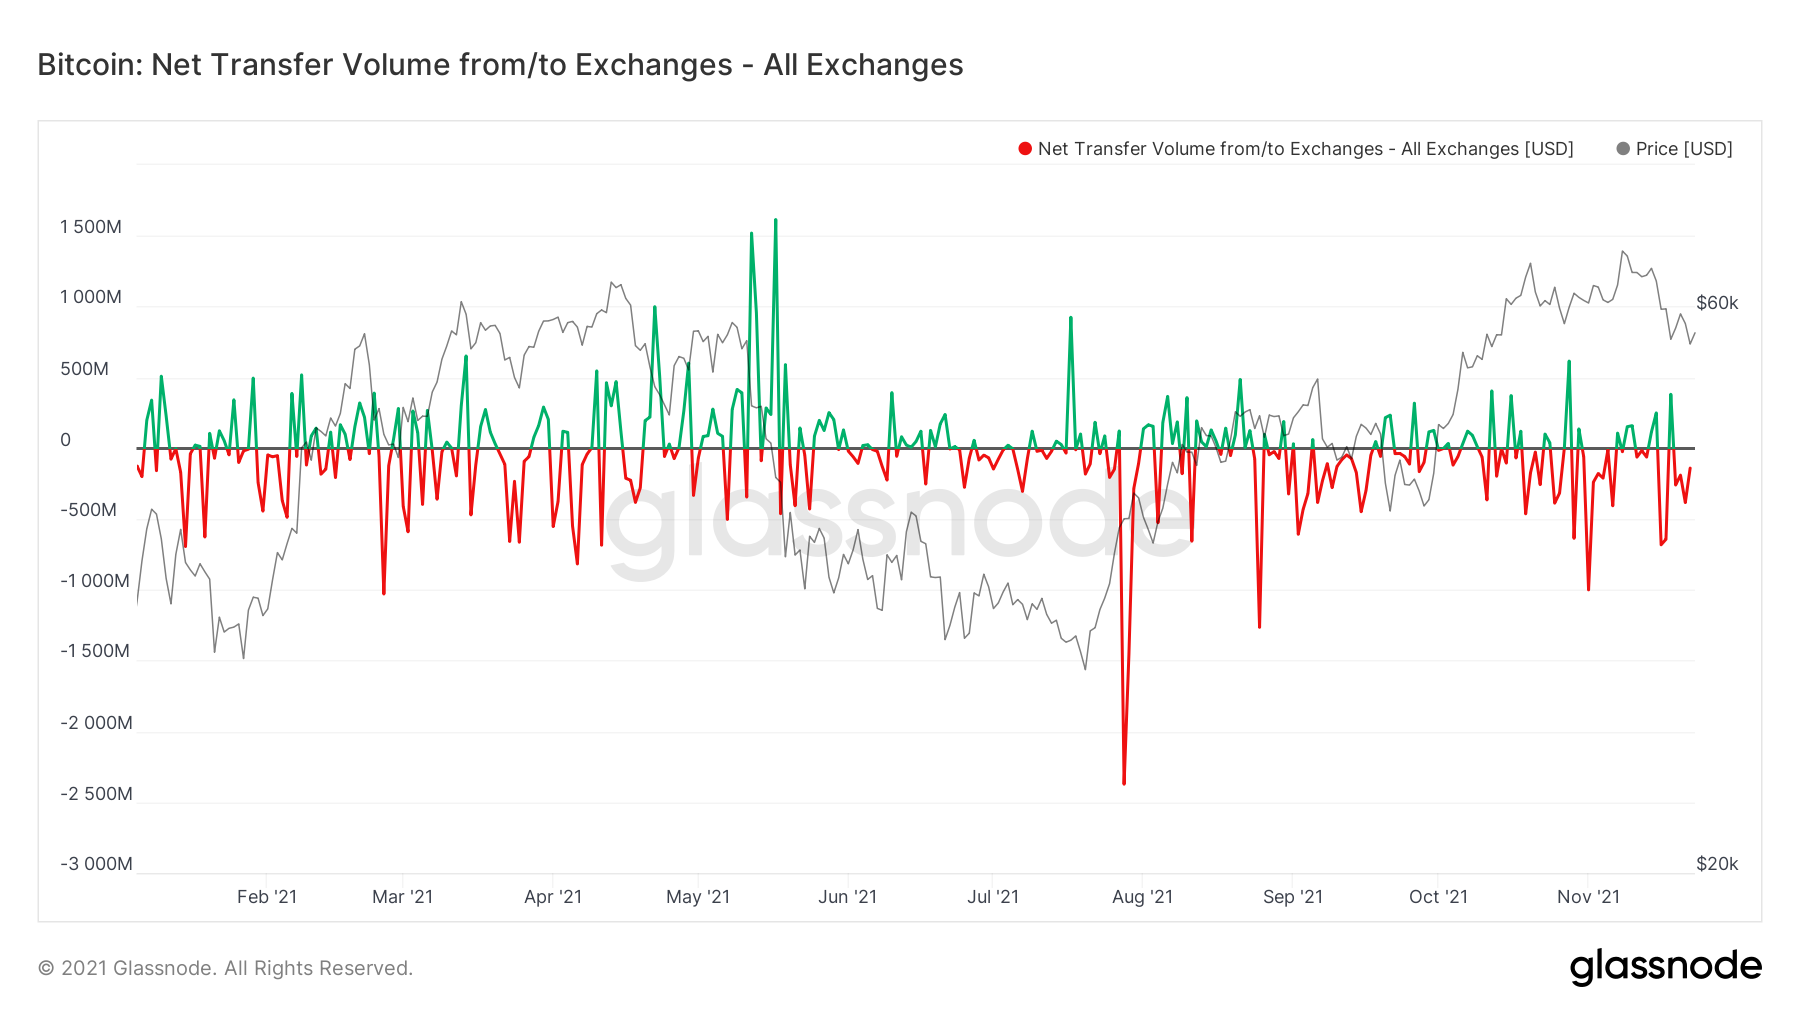
Anytime we see a spike in exchange flow volume it can indicate volatility is coming to the market so traders must be cautious and use proper risk management.
Let’s connect on Twitter. Looking forward to hearing your thoughts and feedback.

Bulls on Crypto Street is a trading education website dedicated to digital assets such as Bitcoin, Ethereum, DeFi, NFTs, and other new advancements in the Metaverse.