
Relative strength is a crucial concept to understand in trading, no matter what market you are in. Relative strength is defined as a momentum trading technique that compares the performance of an asset to that of the overall market. It is especially important in the crypto markets, with Bitcoin tending to be the “leader” of the market trend. For most of this year and last year, we have seen altcoins closely follow Bitcoin’s trend. However, we have seen an interesting change in this pattern recently. Let’s talk about how to use relative strength in your trading, and how to understand this concept in the crypto markets.
Altcoins Tend to Follow Bitcoins Trend
Since the crypto market’s monster run in 2017 we have seen a common trend: When Bitcoin is uptrending, most altcoins tend to follow suit. When BTC shows weakness, most altcoins tend to show weakness. It is similar to how large cap stocks tend to follow the S&P and Dow’s trends. Bitcoin has basically been the index for the crypto markets for the past 18 months. It is rare to find an altcoin that will go on a sustained upward trend while Bitcoin is down-trending or consolidating sideways. It does happen occasionally, and when it does happen, you should take notice.
Relative strength is when an asset shows strength in spite of weakness in overall market weakness. It is a great way of spotting a crypto that is about to begin a strong trend. When an altcoin is green on the day while Bitcoin is down 10%, that coin is showing relative strength. It is often a sign that an asset is set to begin or continue a strong uptrend in the near future. It is crucial to be able to identify cryptos that are showing relative strength to Bitcoin. It will often be a sign preluding a big upward move in the coin.
Binance Coin is a good example of a coin that has shown relative strength to the overall crypto markets. While Bitcoin and most major altcoins have been in downtrends for most of the year, BNB has been trading in a range, and has slowly been grinding to new highs (until recently):
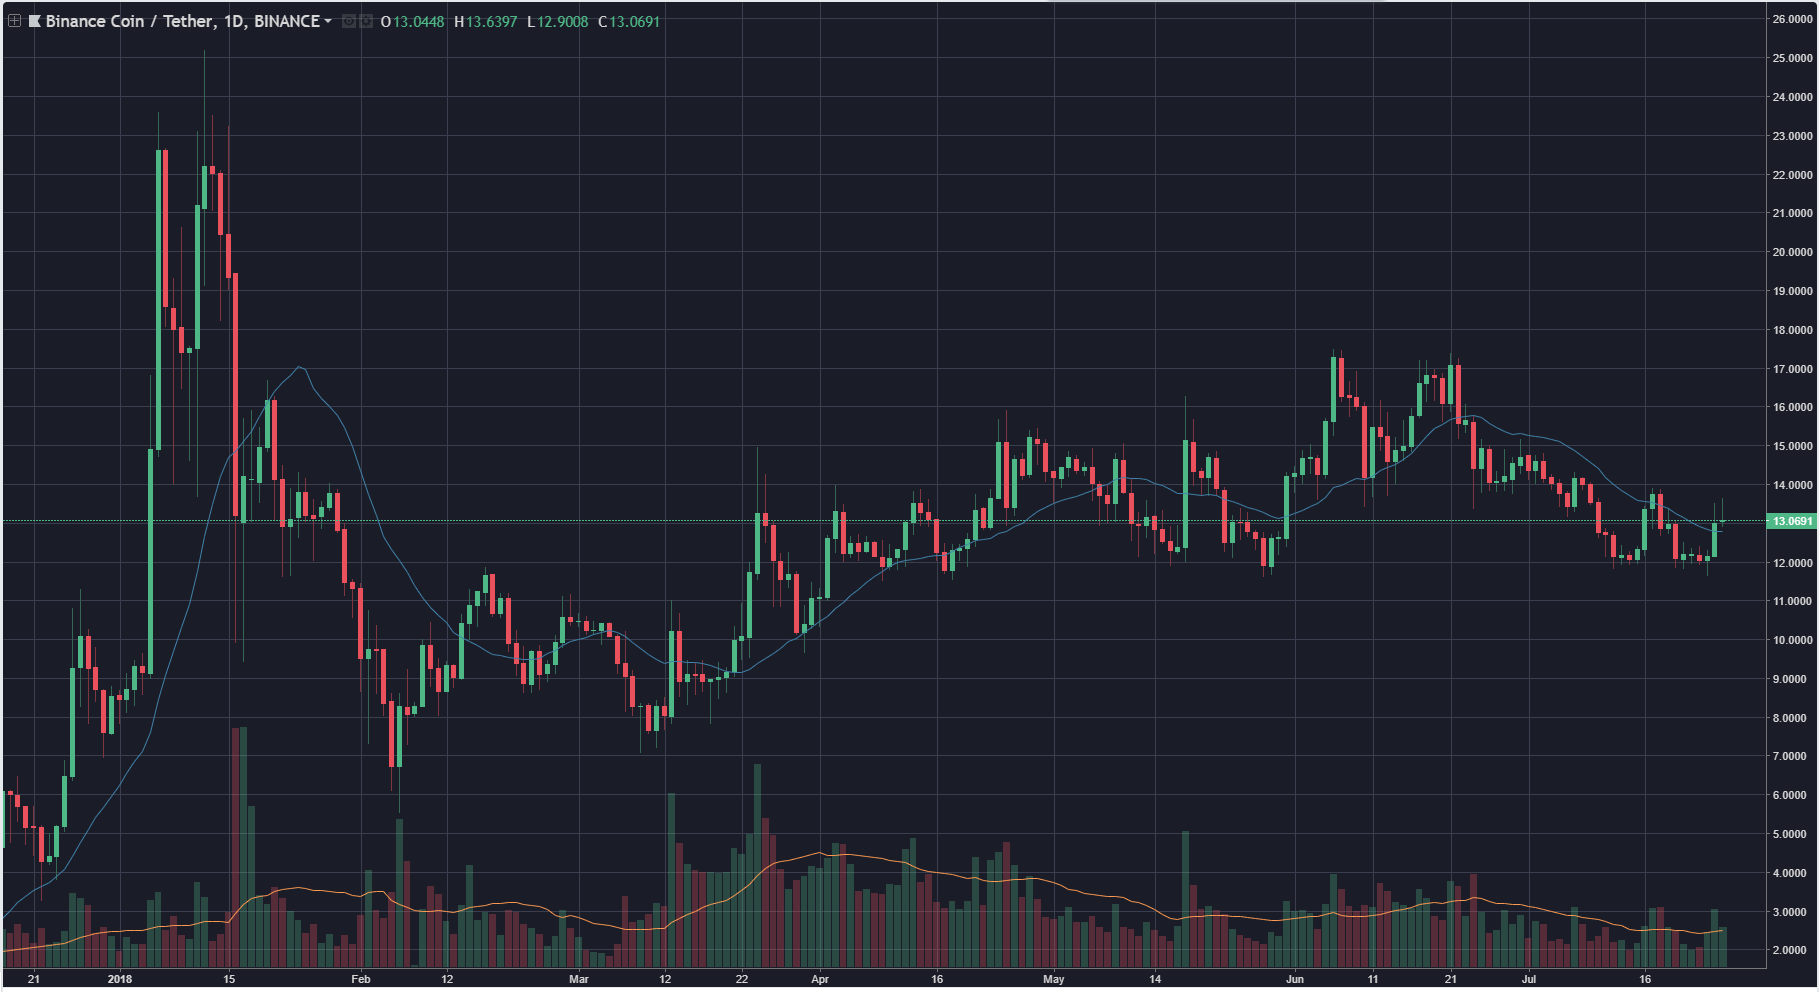
Compare this daily chart to the Bitcoin chart further down in the article.
Recent Divergence In Bitcoin
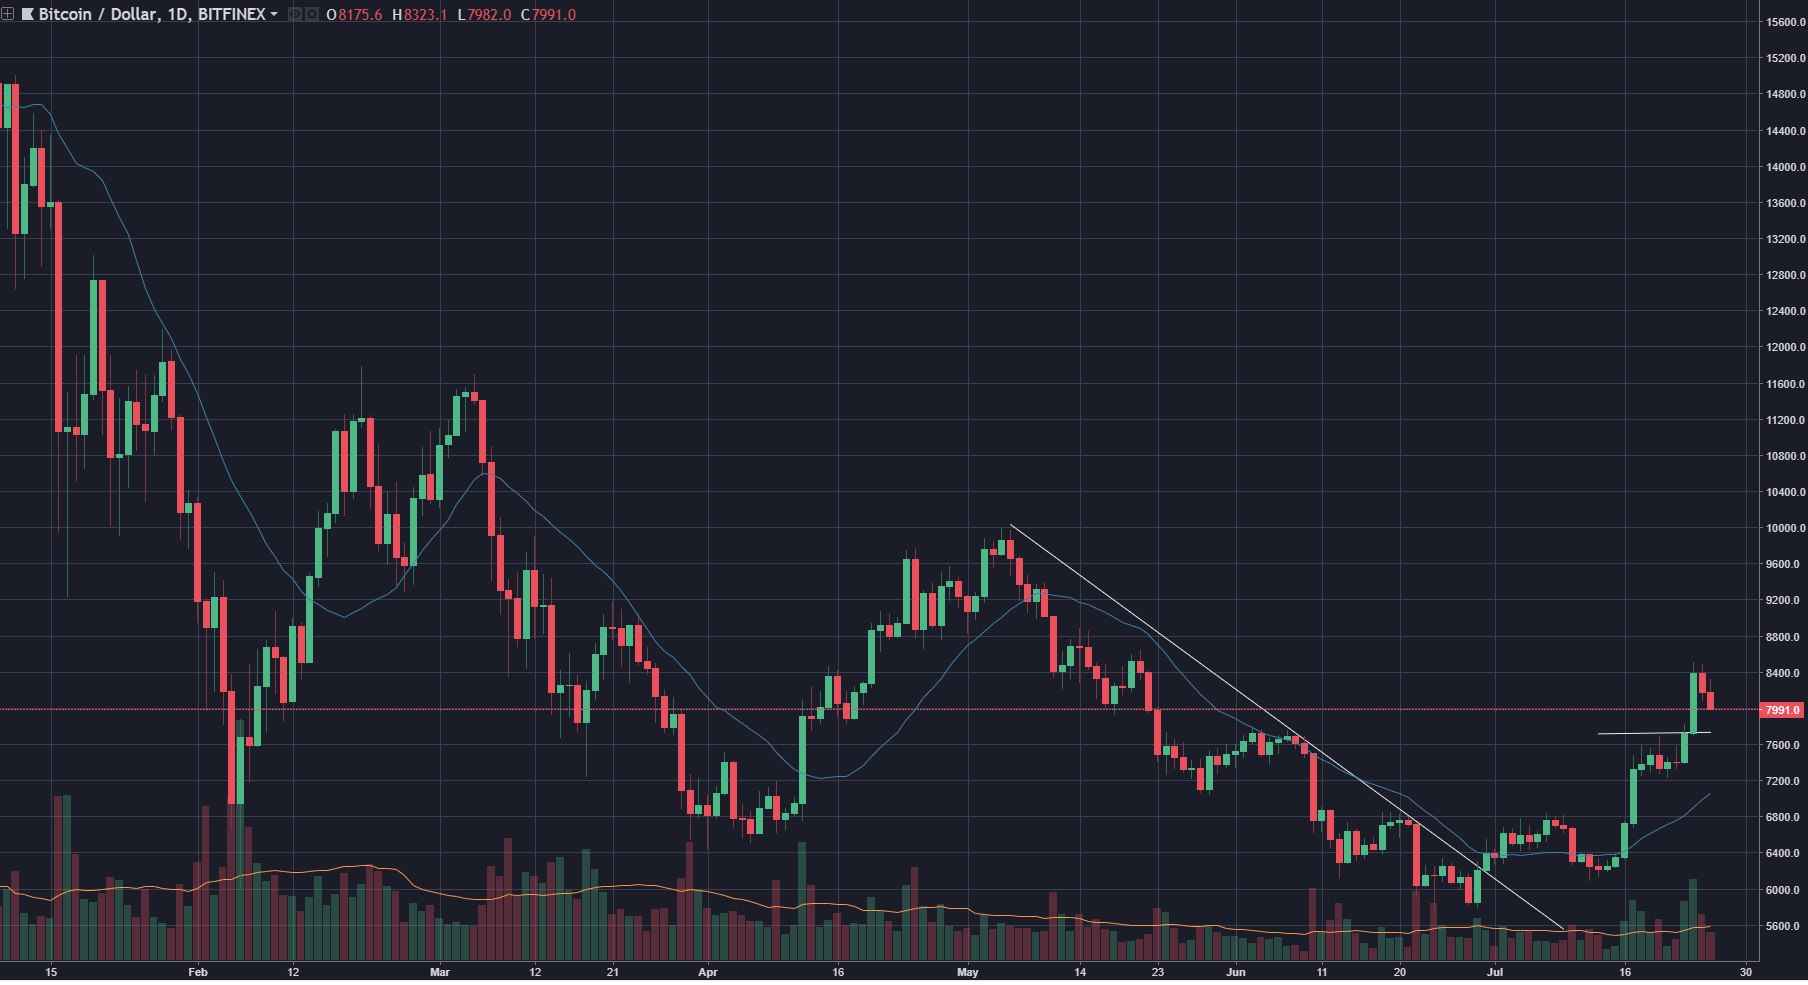
For the first time in a while, we are seeing a big divergence in the trend of Bitcoin and other altcoins. While Bitcoin has been breaking out and making new highs, other altcoins like Ethereum have been trading sideways inside a range. Check out the two daily charts below and see the difference.
BTC
ETH
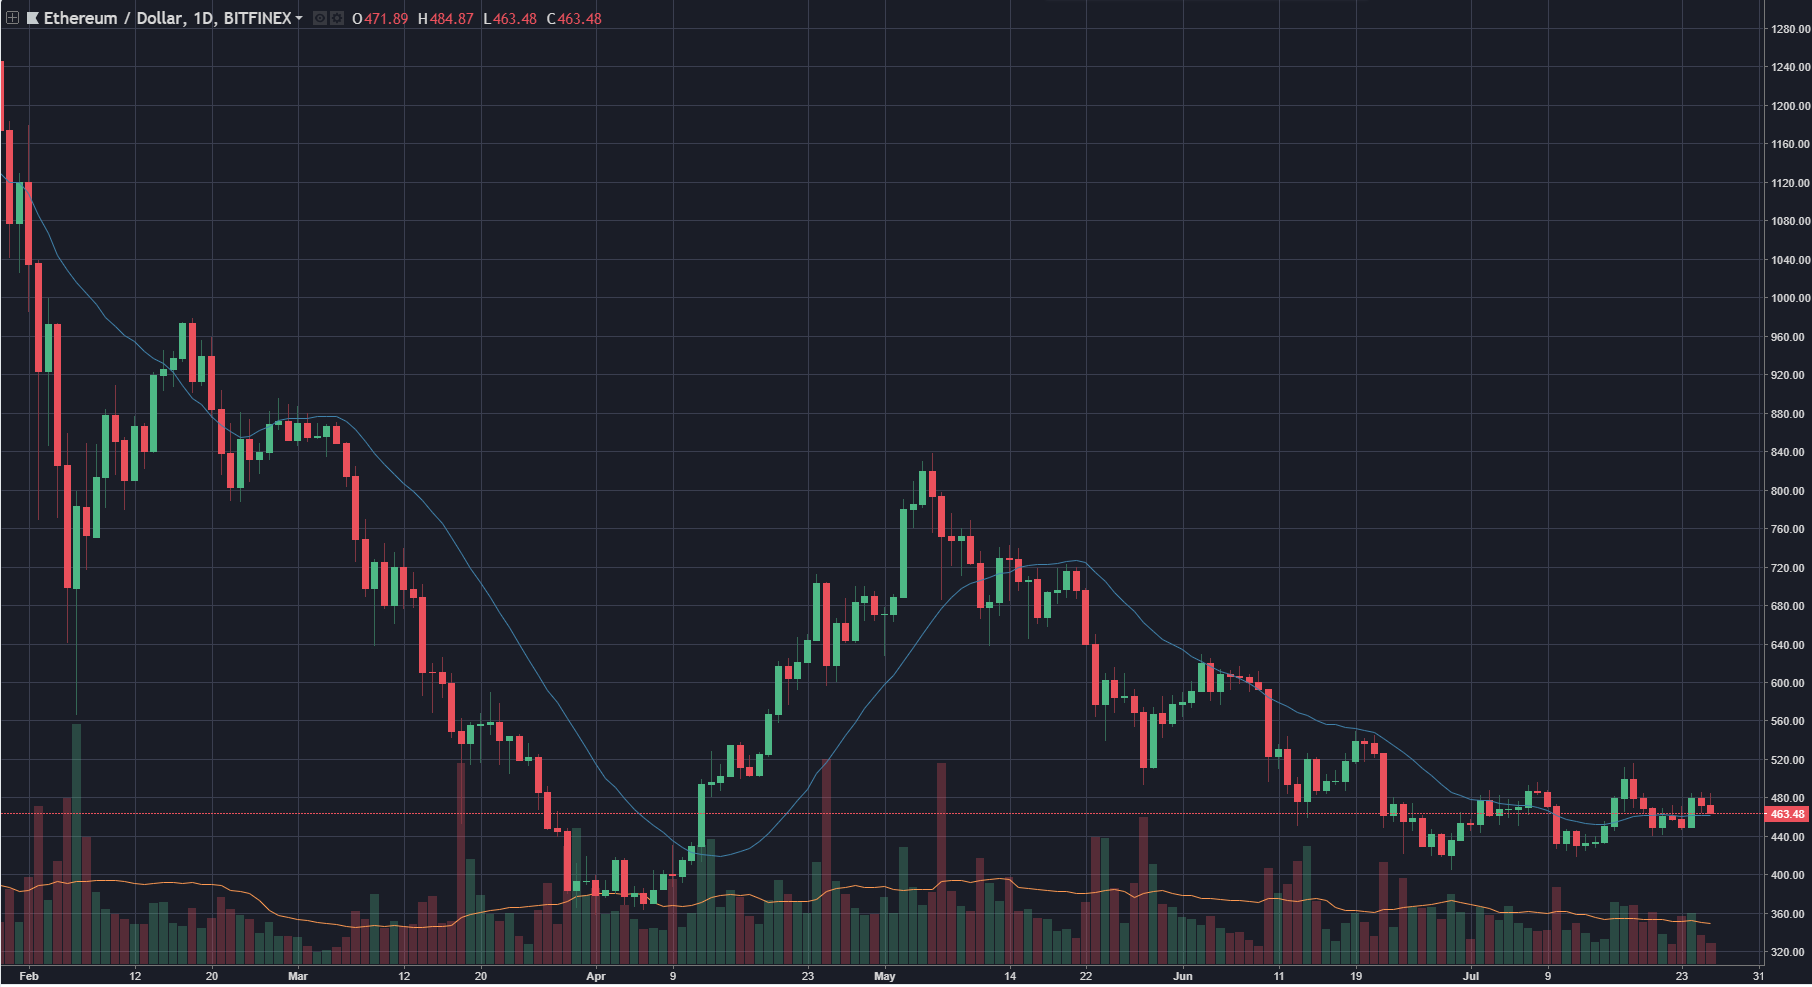
Notice how hard ETH was rejected into the $500 level, while BTC was flagging and showing strength around a week ago. ETH retraced its whole move up after breaking out, and is still consolidating. This is a concept known as relative weakness.
Relative Weakness
The opposite of relative strength in trading is relative weakness. This is when asset is acting weak in spite of strength in the overall market. Many altcoins like ETH and BNB have been demonstrating this in the past week despite the strength in Bitcoin. This is often a sell signal when an asset is down trending or stuck in a range while the market leader is showing strength. It could be that altcoins are just lagging behind BTC at the moment and money may rotate into them later.
At the moment it does not make sense to be long altcoins like ETH, LTC, or BCH just because BTC has been strong recently. They have yet to maintain an uptrend for longer than a few hours, and then they have been getting faded. Wait until these altcoins break out of their ranges before entering them. Do not buy an altcoin. just because Bitcoin is acting strong.
For more analysis on the crypto markets, subscribe to our free newsletter below.

Kunal Desai is an American day trader (stocks and cryptos) and founder of Bulls on Wall Street and Bulls on Crypto Street, two online trading academies and informational publications. He has been featured in many high profile publications like Inc, Forbes, Buzzfeed, and Fortune. He has spoke at trading and business events all across the World.