
In this article, I will focus on two charts. As this market cycle gets more volatile, finding a market top or close too is becoming extremely important.
Every Bitcoin bull cycle consists of local tops and a global top. Local tops are short-term tops before a larger pullback, followed by another price uptrend. During previous Bitcoin bull markets we have seen multiple local tops followed by 30%+ pullbacks. A global top is the final top of the current Bitcoin bull cycle before a likely 80%ish correction.
Long-term holders generally don’t panic from local tops because they understand the volatility of a Bitcoin bull cycle. They’re more concerned about finding the global top. Short-term holders have likely bought in to the mania and don’t want to miss out. They’re more inclined to get nervous during local tops and pullbacks. There are also short term traders that buy and sell based on the momentum. It’s this difference in mindset that causes global tops.
When short-term holders control more of the liquid Bitcoin supply, panic sells become stronger in the market. As short-term holders grow, a global top becomes more likely.
Luckily, with blockchain technology we can track how old a Bitcoin is by tracking when it was last moved.
Here is a chart we replicated from the Glassnode founders.
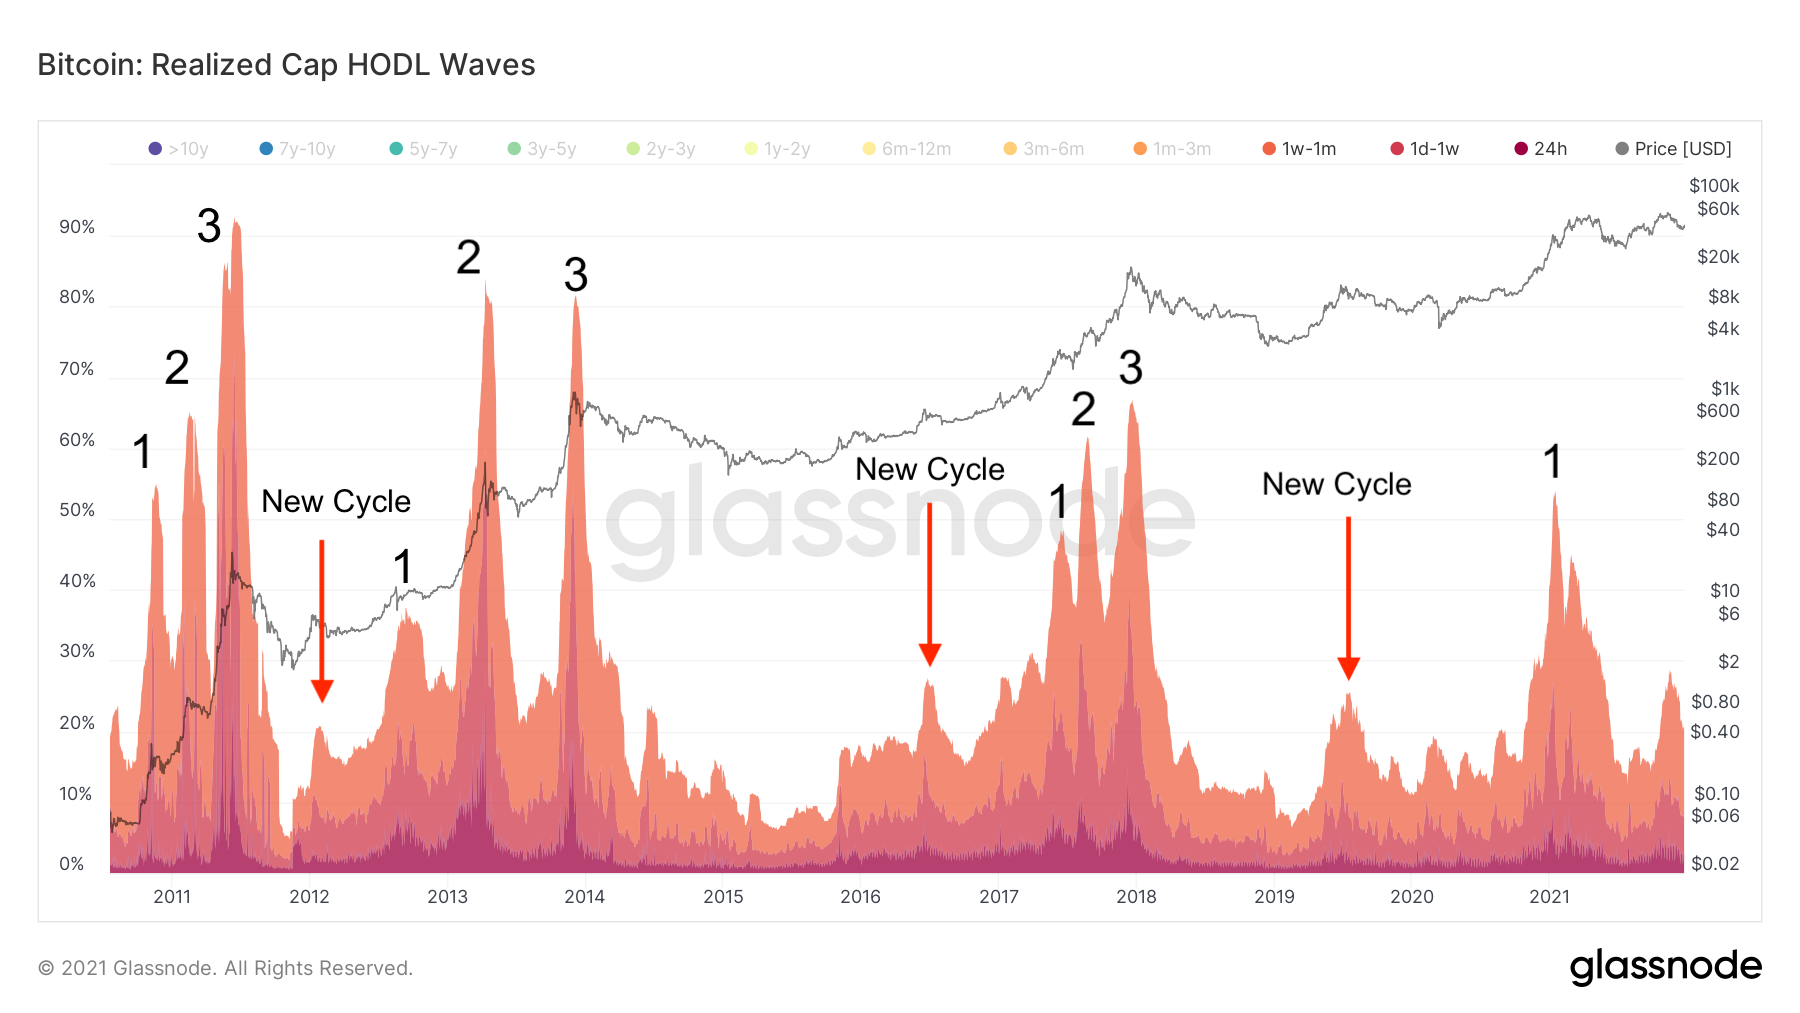
They have found that coins that are 1 month old or younger (short-term holders) start to make up 60% of the realized cap or more, a global top is coming. For a breakdown of what realized cap is click here.
They have also found that towards the end of the bull cycle there are three tops on this metric before the final 80% correction. Currently, we stand at one top for this metric this bull cycle.
Another metric that pairs nicely with this is how long-term holders’ Bitcoin are affected in this metric.
Let’s look at another chart replicated from the Glassnode founders.
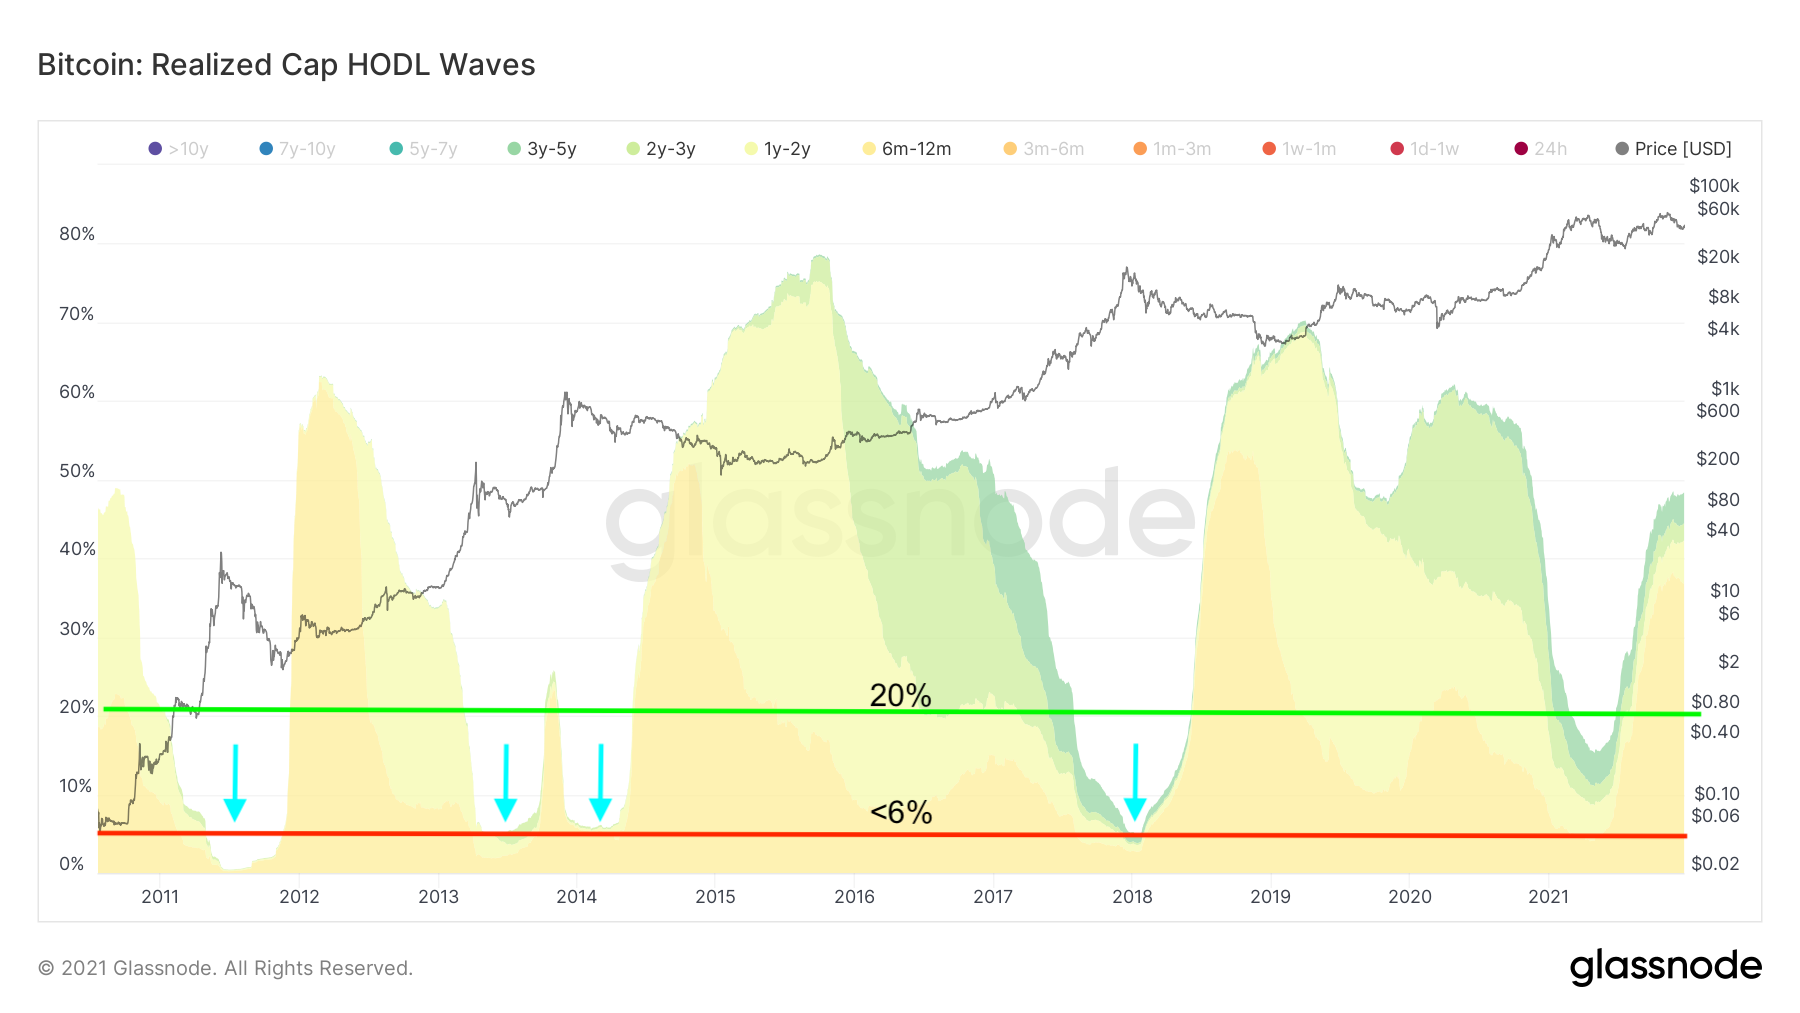
As short-term holders start to dominate on-chain activity, long-term holders with Bitcoin that are 6 months or older start to decrease in realized cap. According to them, when these long-term holders get to around 6% we get into extreme territory when weaker hands are controlling most of the liquid Bitcoin.
Currently, we stand at around 48% giving Bitcoin more room to increase in price.
The reason for all of this goes back to the mindset difference we spoke about at the beginning. Weaker hands sell faster in a pullback out of fear. If weaker hands control the majority of the liquid Bitcoin supply, a bigger price correction occurs; local top becomes global top. This mixed with larger savvy investors taking profits creates a massive sell-off until the Bitcoin price finds a new cycle bottom.

Bulls on Crypto Street is a trading education website dedicated to digital assets such as Bitcoin, Ethereum, DeFi, NFTs, and other new advancements in the Metaverse.