
If you’re a frequent reader of this blog then you’re already familiar with Realized Cap. If you’re new then I suggest reading our article on Realized Cap. I will give a brief description in order to better explain MVRV.
When calculating the value of a market like Bitcoin, most investors will use Market Cap which is the current price multiplied by the current supply. However, this metric doesn’t necessarily capture the fair value of the market due to periods of extreme euphoria and periods of extreme fear. Realized Cap was created to give a more accurate fair value of the Bitcoin market by taking into account lost coins and coins used for hodling.
Realized Cap uses UTXO’s to calculate the value of the market. A UTXO values each Bitcoin at the price when it was last moved. For example, if I send 1 Bitcoin to another address when the price is $40,000, even if the price goes up to $50,000 the realized value of that Bitcoin is still $40,000 until it gets moved again. Many top Bitcoin investors have accepted this to be a better way to value the Bitcoin market.
The MVRV Ratio is essentially the Market Cap to Realized Cap ratio. During periods of greed and euphoria the MVRV Ratio increases as a mass of new entrants come into the market and buy Bitcoin from all the hype and momentum. This drives up the Market Cap significantly in comparison to Realized Cap. According to David Puell in his article about MVRV, during bull cycles an MVRV Ratio above 3.7 is close to the peak of the cycle and in bear cycles an MVRV Ratio of around 1 is close to the price bottom.
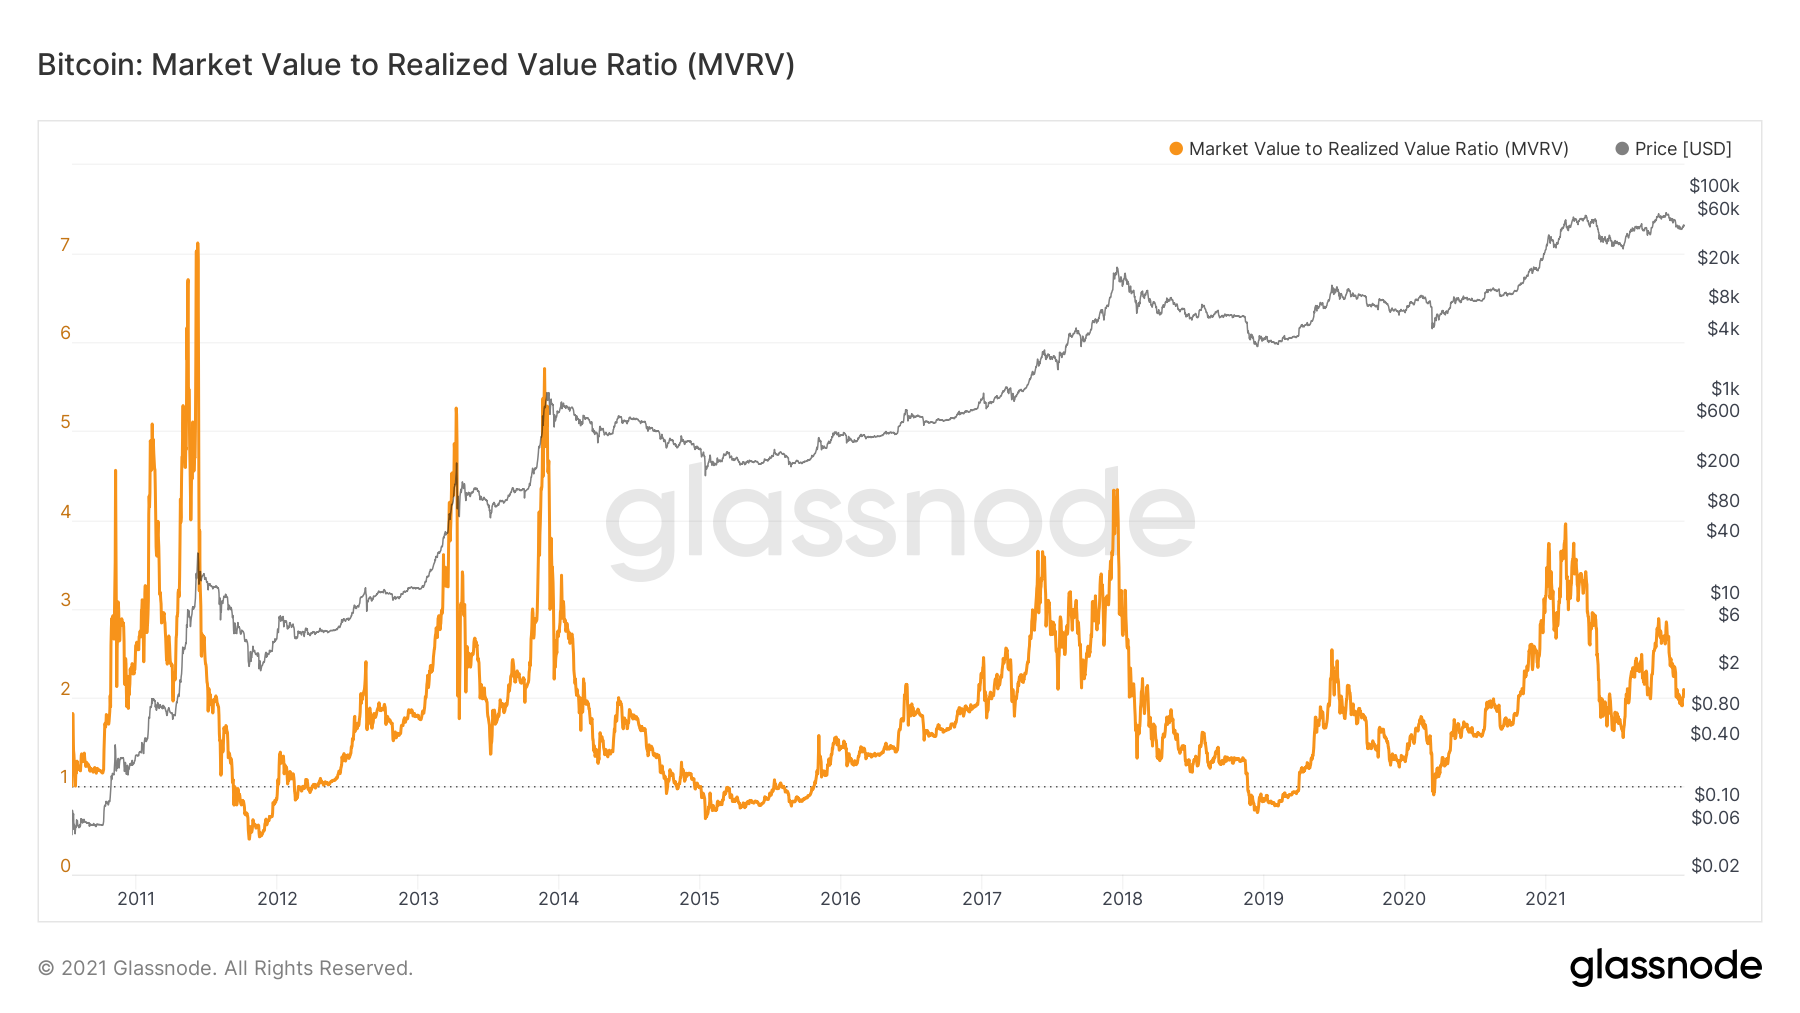
As you can see, we’re currently hovering around the 2 area after the big correction from the summer. Going deeper into the metric there still appears to be more room for the Bitcoin price to move.
Next comes the MVRV Z-Score which uses the MVRV Ratio to find overvalued and undervalued markets by also taking into account the market cap standard deviation.
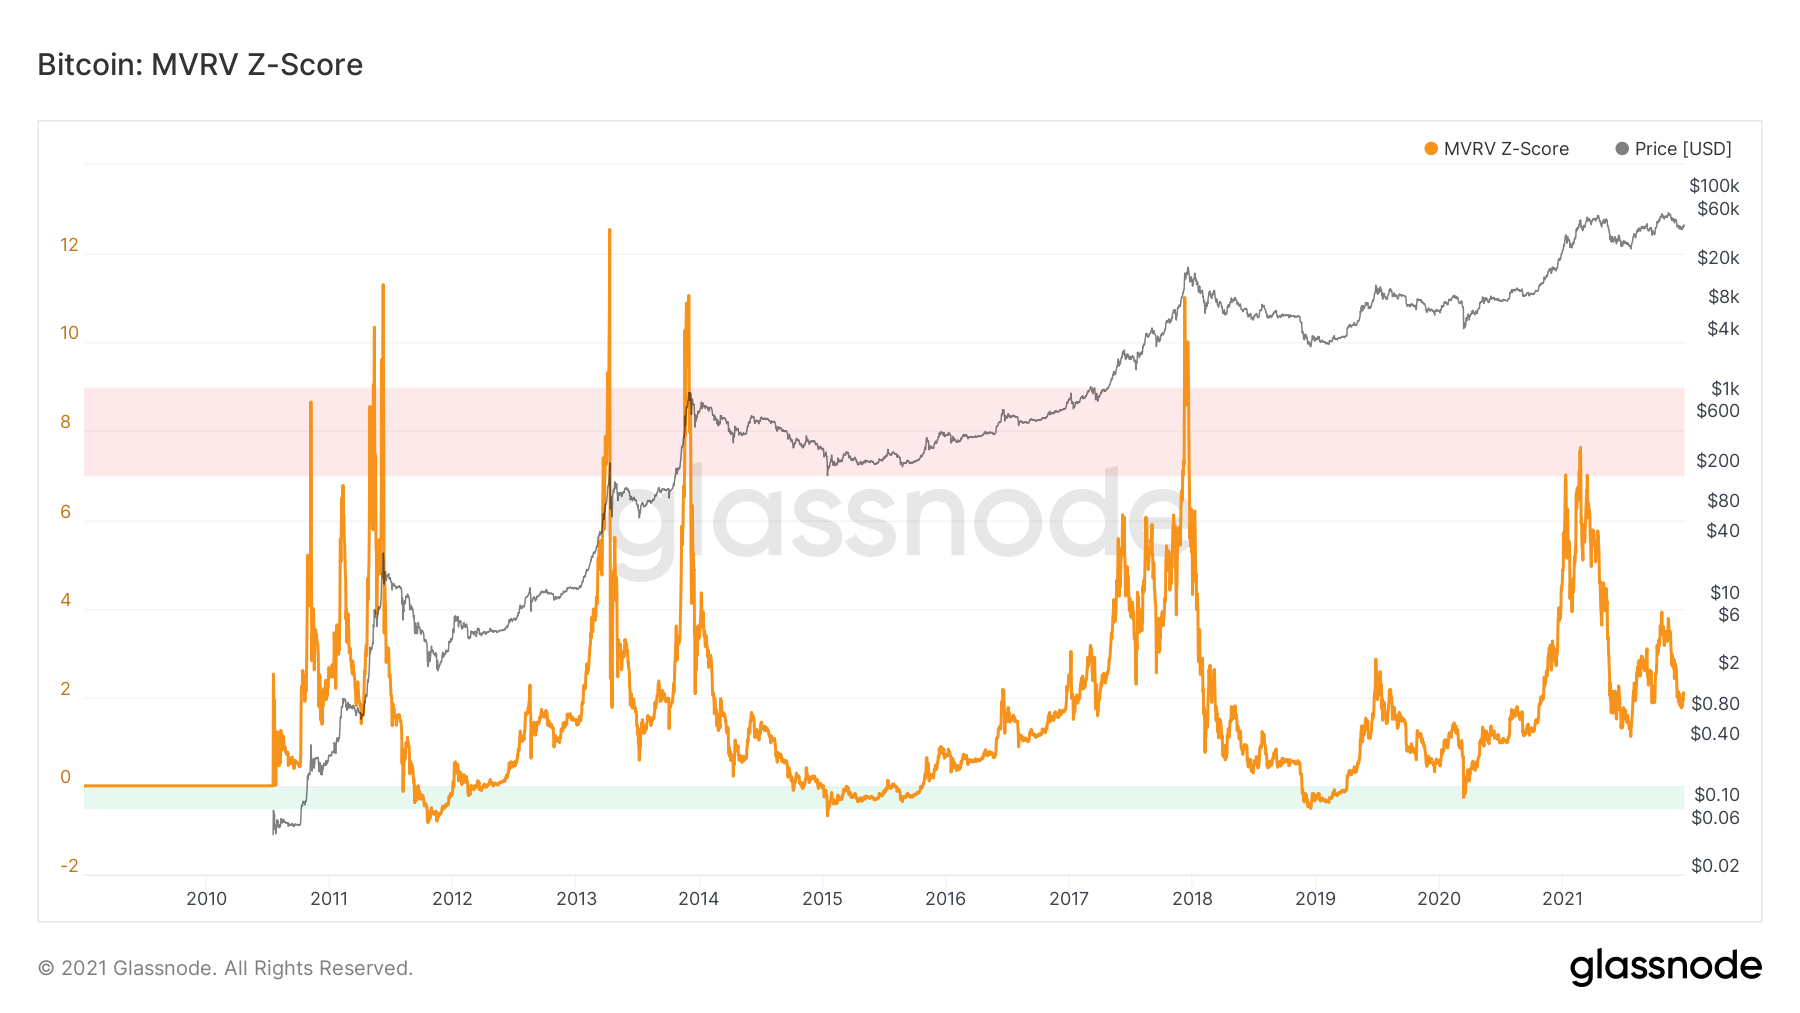
Similar to other metrics we have looked at, MVRV Z-Score gives us a red zone and green zone for sell and buy areas respectively. We hit the red zone in the middle of 2021 before the major correction.
We’re at a very interesting and stressful time in the Bitcoin bull cycle. The price has made an incredible run. However, we must ask ourselves if Bitcoin has made that last parabolic move that usually tops out bull cycles. It’s definitely getting close but there could still be a lot more in the tank for BTC!

Bulls on Crypto Street is a trading education website dedicated to digital assets such as Bitcoin, Ethereum, DeFi, NFTs, and other new advancements in the Metaverse.