
Following up on our last article on MVRV, today we will talk about another top indicator.
The Pi Cycle Top Indicator was created by Philip Swift. It’s a very simple indicator to use and has been reliable in picking out market cycle tops within only a few days. The indicator uses an 111 day moving average and a 350 day moving average x 2.
If you’re unfamiliar, a moving average is used in technical analysis finance to smooth out pricing data of a ticker and get a better idea of the average over a set period of time. For example, with the 111 day moving average were taking the arithmetic mean of the prices over the last 111 days and plotting a line on the chart. Some traders use moving averages as potential support and resistance areas.
For the 350 day moving average x 2, we’re using the same concept but multiplying each price value of the 350 day by 2.
The reason this indicator is called Pi Cycle is because when dividing 350/111 we get the closest value to Pi (3.153 -> Pi = 3.142) when dividing 350 by a whole number.
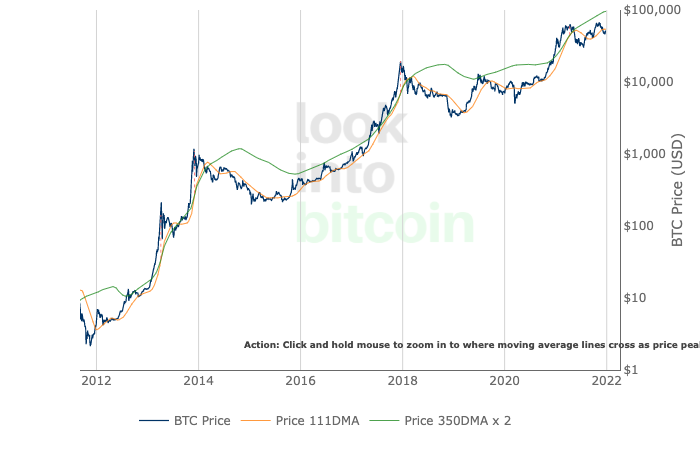
Using this indicator is very simple. Every time the 111DMA (orange line) crosses the 350DMA x 2 (green line) to the upside, that has signalled a market top in previous bull cycles. It has been extremely accurate in all 3 previous bull cycle tops.
The logic behind the indicator is showing us that when the 111DMA crosses, the market is extremely overheated so much that a short-term 111 day moving average has reached a 2x multiple of the 350 day moving average. This gives us an indication that hype has taken over and short term buyers are controlling too much of the liquid supply.
As we can see in the chart, it looks as if the 111DMA crossed the 350DMA x 2 in April of this year. Let’s take a closer look.
During the 2017 bull run, the 111DMA got close to the 350DMA x 2 all the way down at around $4,000 BTC. As the run-up continued there were pullbacks that moved the 111DMA back down since it’s more re-active to short-term prices changes which prolonged the eventual crossing at around $19,000 BTC.
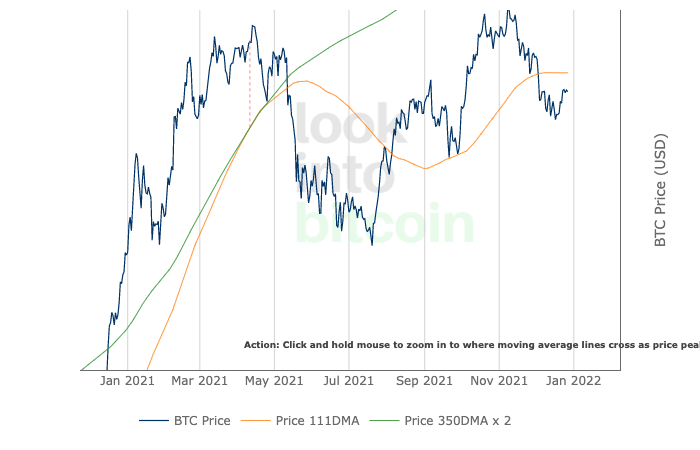
At a closer glance, there was a cross in April highlighted by the vertical red line. This coincided with a massive pullback of 50%+.
However, we must now consider that was the end of that current bull trend with the possibility of a short-term bear market through the summer and a new bull market. As we now know that was not the top since the Bitcoin price rebounded and passed that top before another correction. There is know doubt this cycle is playing out different than previous ones. With new players invested and different macro outlook, we could be seeing a new kind of cycle.

Bulls on Crypto Street is a trading education website dedicated to digital assets such as Bitcoin, Ethereum, DeFi, NFTs, and other new advancements in the Metaverse.