Recently, we have written about short-term holders vs long-term holders. Also, we discussed Realized Cap. Both of these variables play into todays metric called Realized HODL Ratio.
Through our research writing this blog we have found that price appreciation in Bitcoin bull markets coincides with short-term holders entering the market and taking majority share of on-chain activity. Generally, this starts to happen in the middle of the cycle.
The Realized HODL Ratio (RHODL) by Glassnode allows us to combine all the elements that contribute to this analysis into one metric.
Using RHODL, short-term holders are considered investors holding Bitcoin for 1 week – 1 month. Long-term holders are investors holding from 1-2 years. The metric takes the ratio between the two and normalizes it by the realized cap. If you’re not familiar, Realized Cap is similar to Market Cap but instead values each Bitcoin by the price when it was last moved instead of the current price.
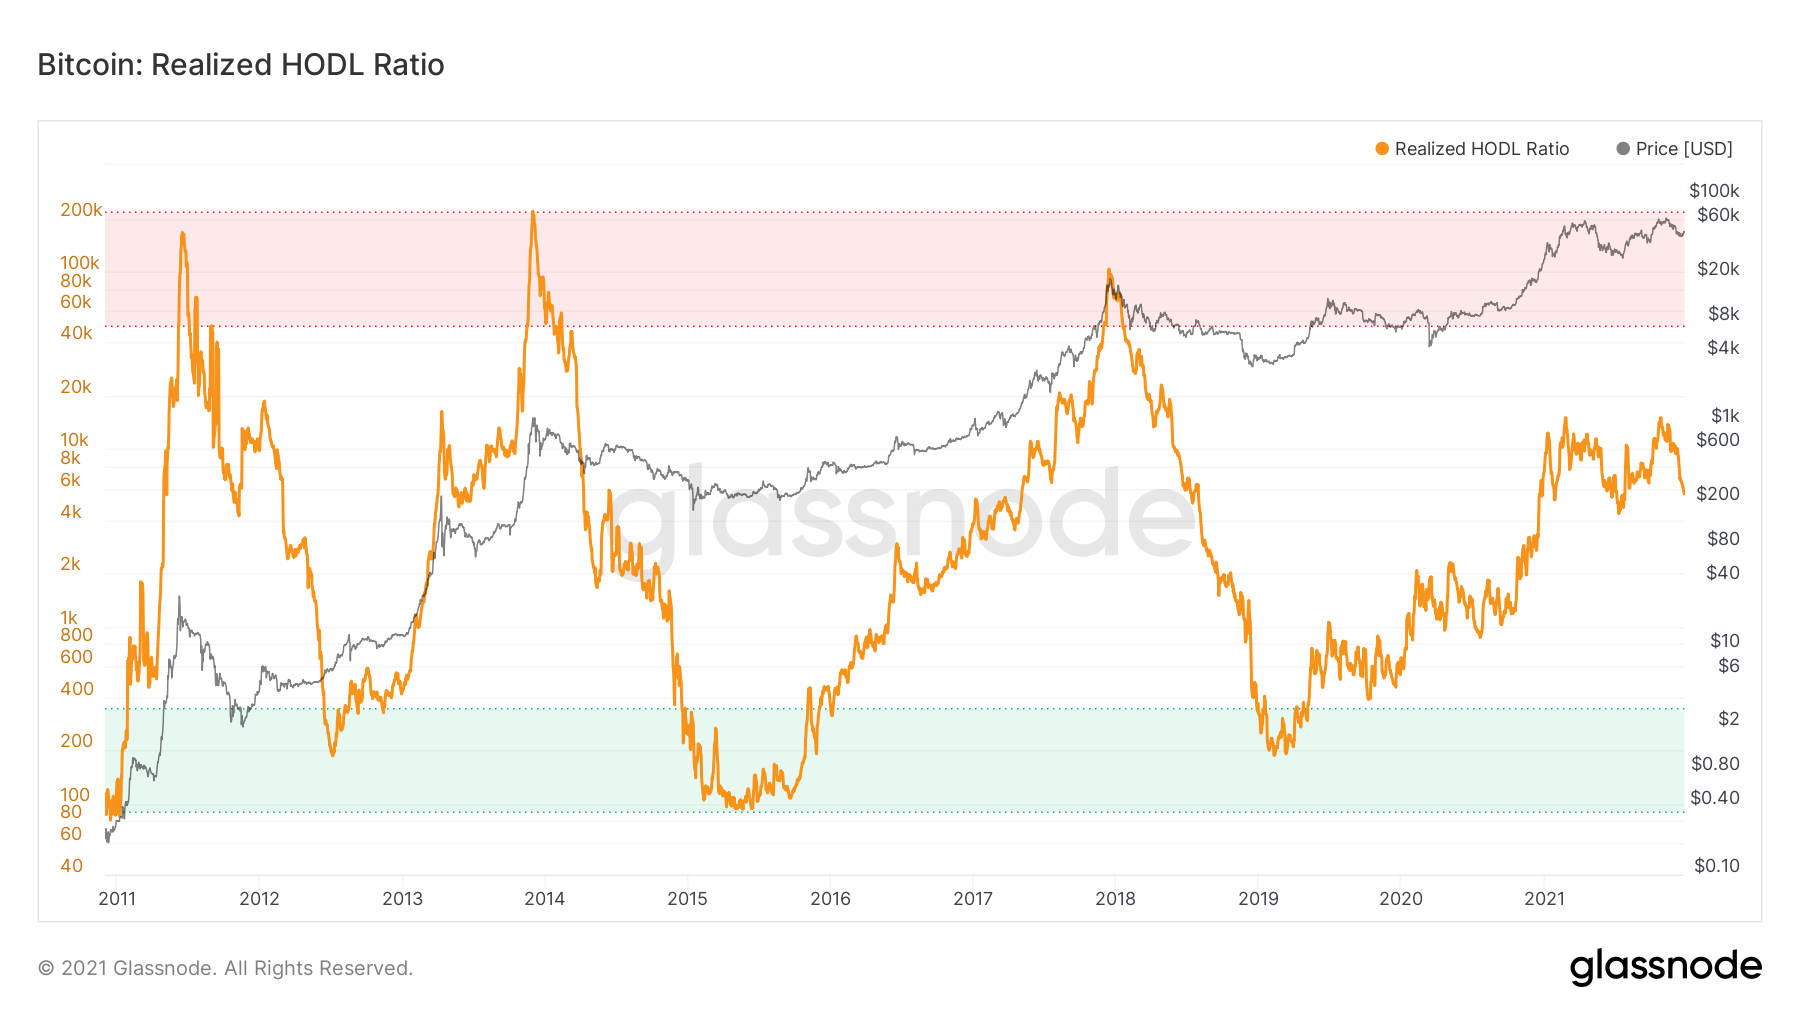
As the ratio increases the Bitcoin market starts to over extend until it gets to a market peak. This metric is useful in finding local tops and the global top of the whole bull cycle.
As the chart stands, we’re currently just above the mid point until we start to hit the red zone. The red zone has been a sell area in past market cycles. According to the founders of Glassnode, RHODL is showing signs of a similar uptrend to 2013 and 2017 where a clear local top was put in, followed by consolidation, and then a continuation until the global top.
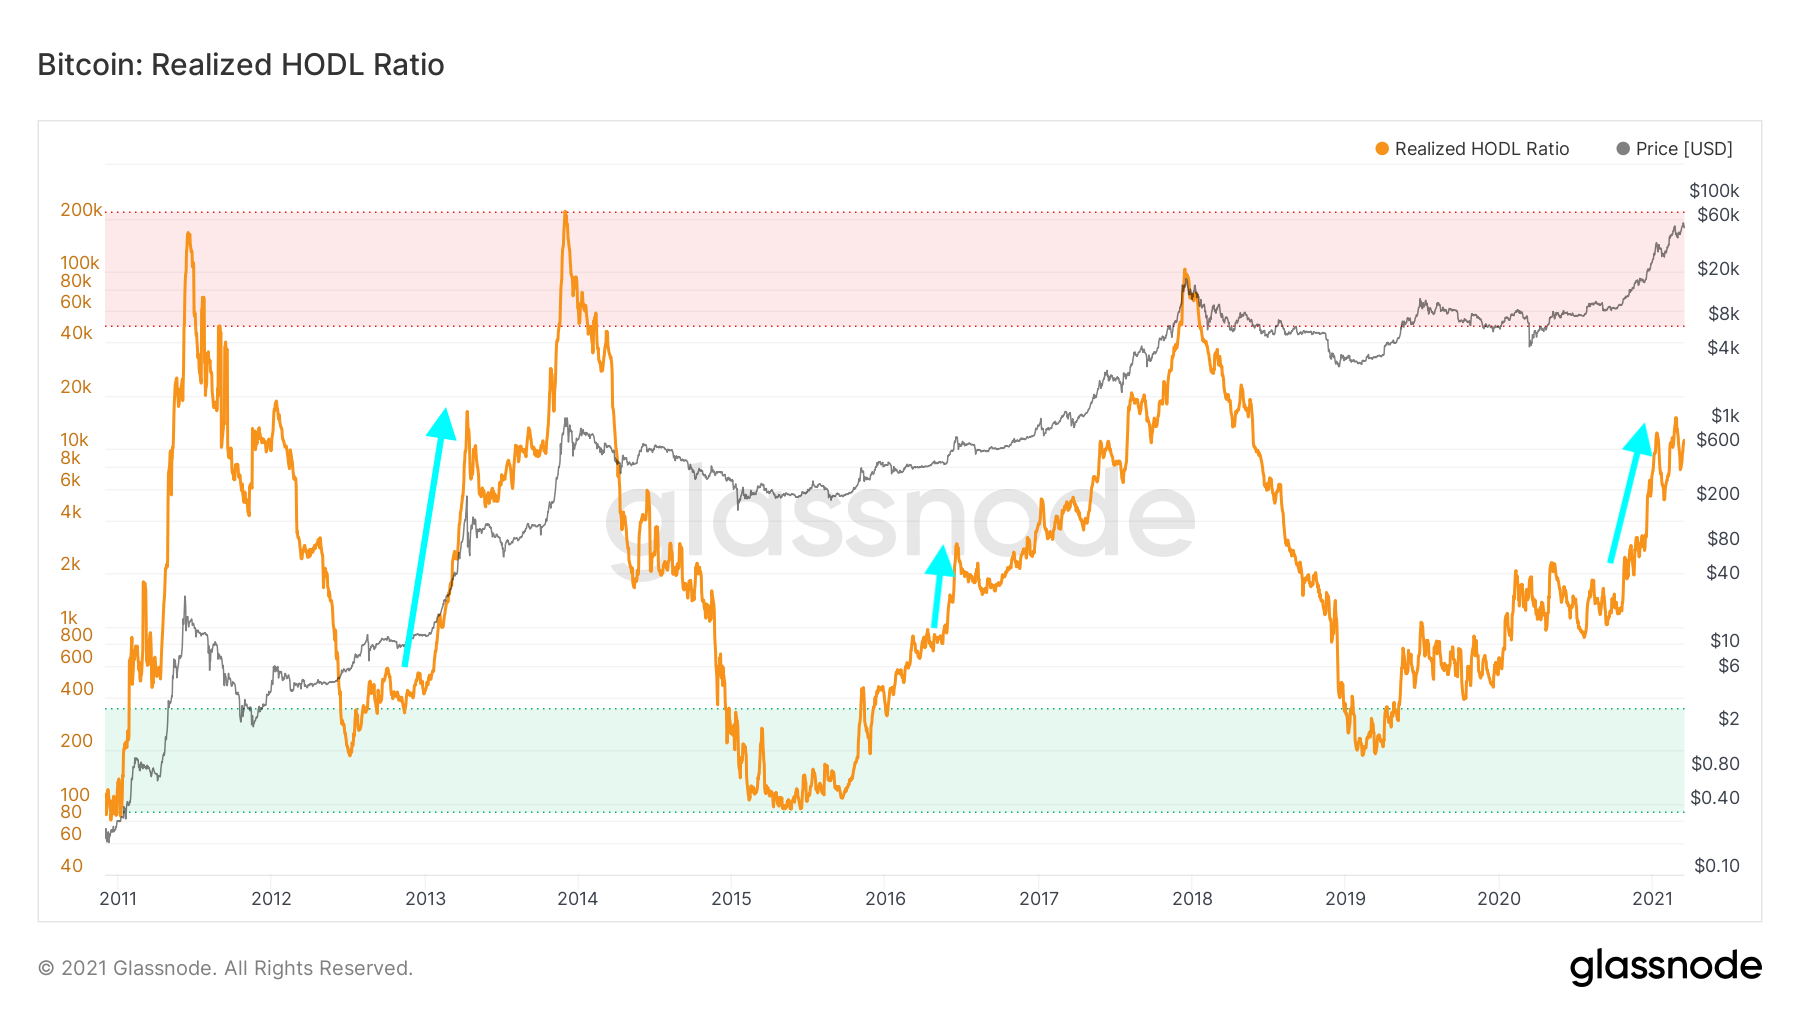
You can see from the blue arrows, how they view this cycle is measuring up to past bull cycles in regards to RHODL. This could lead to a possible global top around Q1 or Q2 2022 which roughly lines up with other popular analysis in the Bitcoin market.
There are two important things to remember about this metric:
- Short-term holders enter in the middle of the bull cycle as they see hype and momentum come into the market. They’re the last to enter and play a big part in causing spikes and the last parabolic move. However, just as easy as they came in on hype, they will leave on fear. It’s important to time your moves before them, both on the buy side and the sell side. We also have to consider swing traders who buy on momentum and sell for profit taking. This plays a big role in local tops and also the global top since the global top is technically the last local top of the cycle.
- A real sign of a global top is when long-term holders start to sell in big numbers. Long-term holders create the floor price. naturally they will sell into spikes during a bull cycle but when we start to see them selling in larger numbers, that’s when we know a local or global top is likely coming.

Bulls on Crypto Street is a trading education website dedicated to digital assets such as Bitcoin, Ethereum, DeFi, NFTs, and other new advancements in the Metaverse.